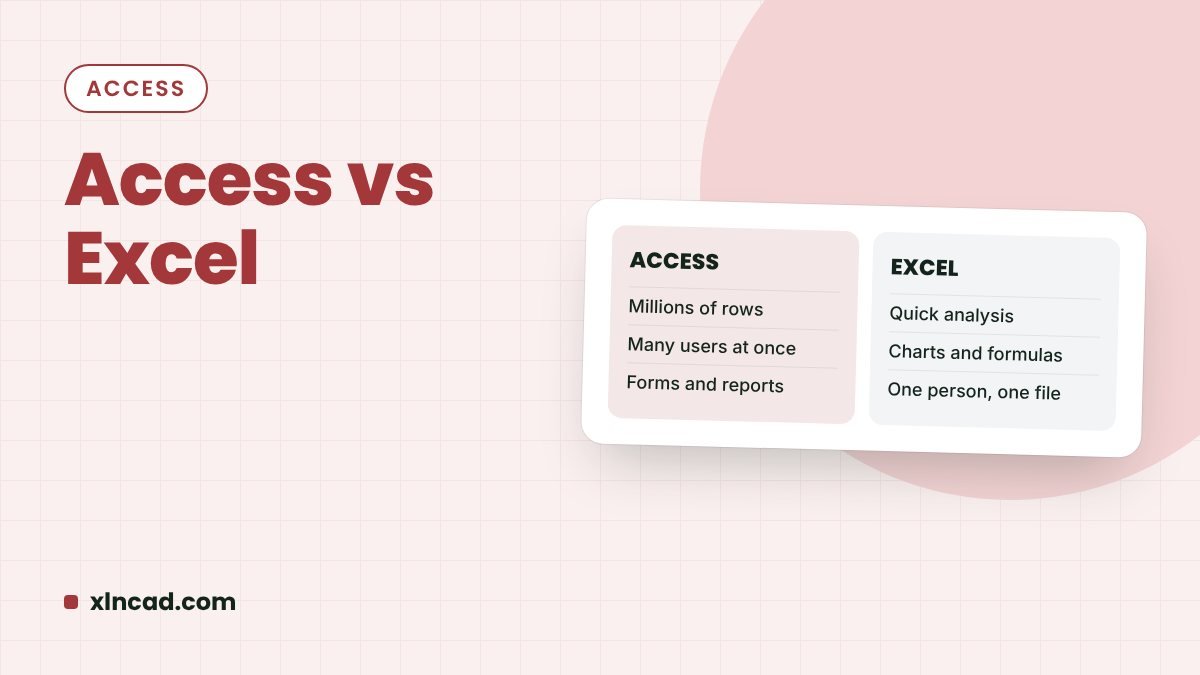
Excel is best for calculating, analysing and charting data. Access is best for storing a lot of related data that several people enter and search. Many teams use both: Access to store, Excel to analyse.
Side by side
| Excel | Access | |
|---|---|---|
| Best for | Calculations, analysis, charts | Storing and managing records |
| Data size | Up to 1,048,576 rows per sheet | Up to 2 GB per database file |
| Several users at once | Possible, but conflicts are common | Built for it |
| Related tables | Lookups between sheets | Relationships between tables |
| Data entry | Type into cells, or a form | Forms with drop-downs and validation |
| Reports | Charts, PivotTables | Printable reports grouped by any field |
| Learning curve | Easy to start | Needs planning: tables and fields first |
Use Excel when
- The data fits on one or two sheets and one person updates it.
- You need formulas, what-if analysis, charts or PivotTables.
- You share the file by email and others need to open it without Access.
Use Access when
- You have many records, or several related lists such as students, courses and fees.
- Several people enter data at the same time.
- You need a data entry form with drop-downs, photos and rules.
- You run the same searches and printed reports again and again.
Use both together
Store the data in Access and analyse it in Excel. In Excel, go to Data › Get Data › From Database › From Microsoft Access Database to load a table or query into a PivotTable. To move data the other way, import Excel data into Access.
FAQ
Is Access going away?
Access is still part of Microsoft 365 business plans and is updated. It is not available on Mac or the web.
Can Excel replace Access?
For small lists, yes. For many related tables and several users entering data, Access is more reliable.
What about Power Pivot?
Power Pivot lets Excel analyse millions of rows, but it is for analysis, not data entry. See Power Pivot.