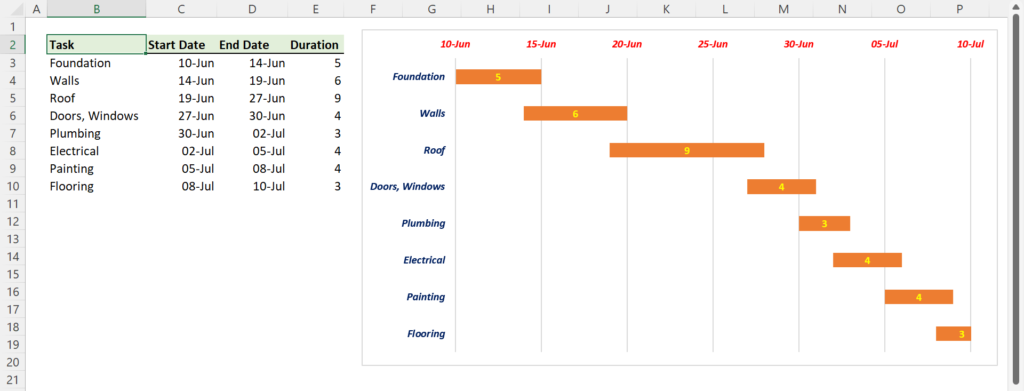
A Gantt chart shows each task of a project as a bar along a calendar. Excel doesn’t have a Gantt chart type, but a stacked bar chart with the first series hidden gives you one in about ten minutes.
Table of Contents
Video
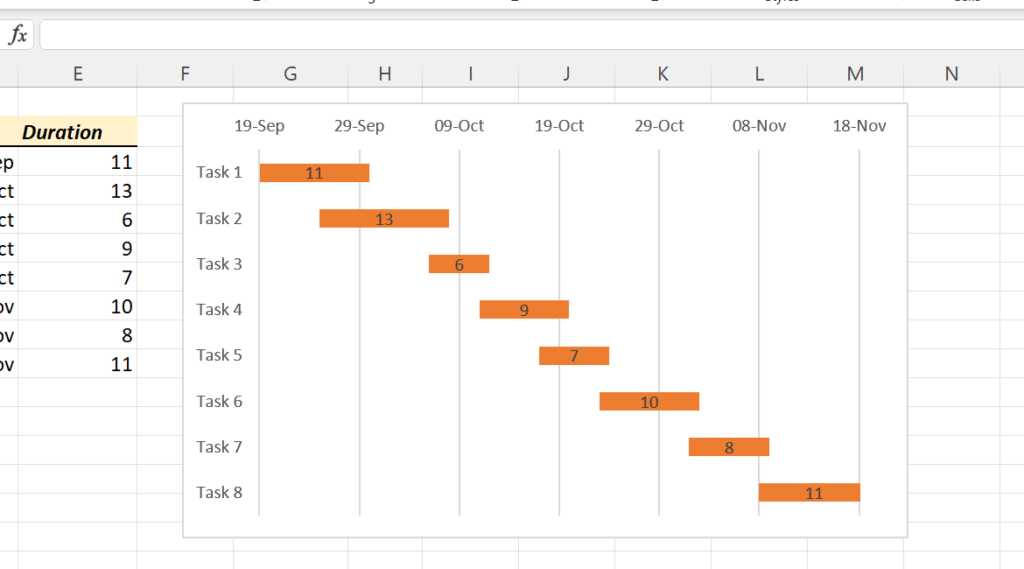
The finished chart
Step 1: Task list and durations
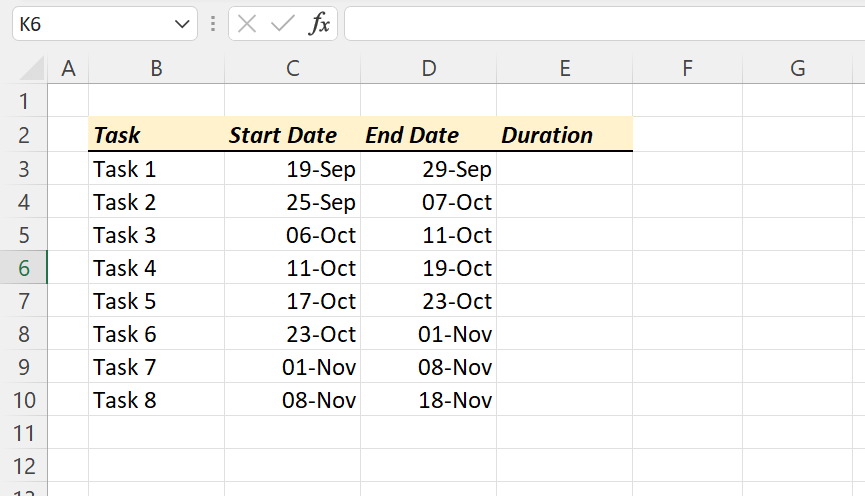
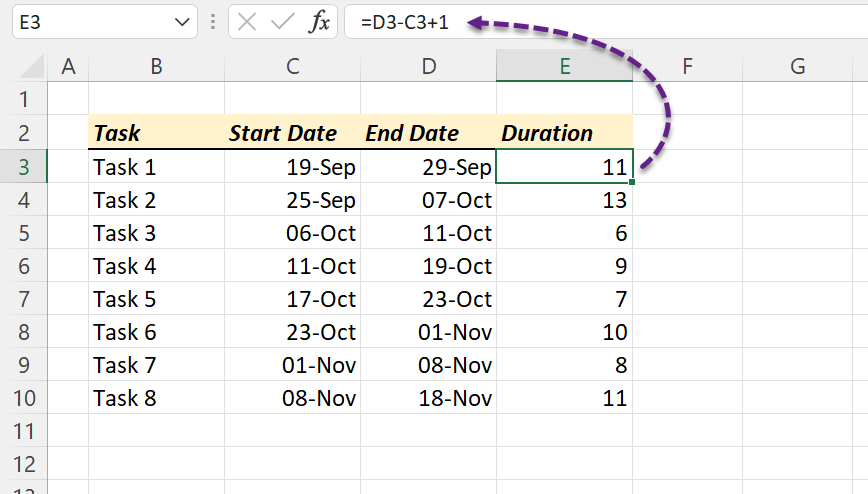
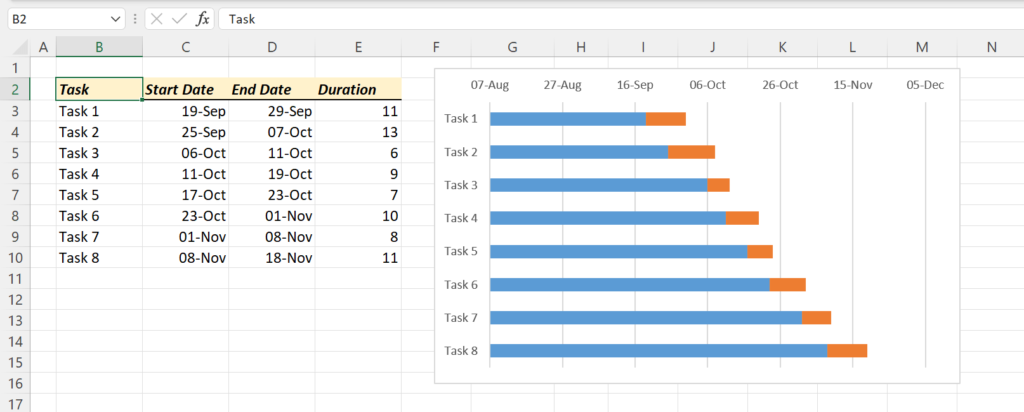
List each task with its start and end date. Work out the duration in days, counting both the start and end day:
=D3-C3+1(End date minus start date, plus 1.)
Step 2: Stacked bar chart of the start dates
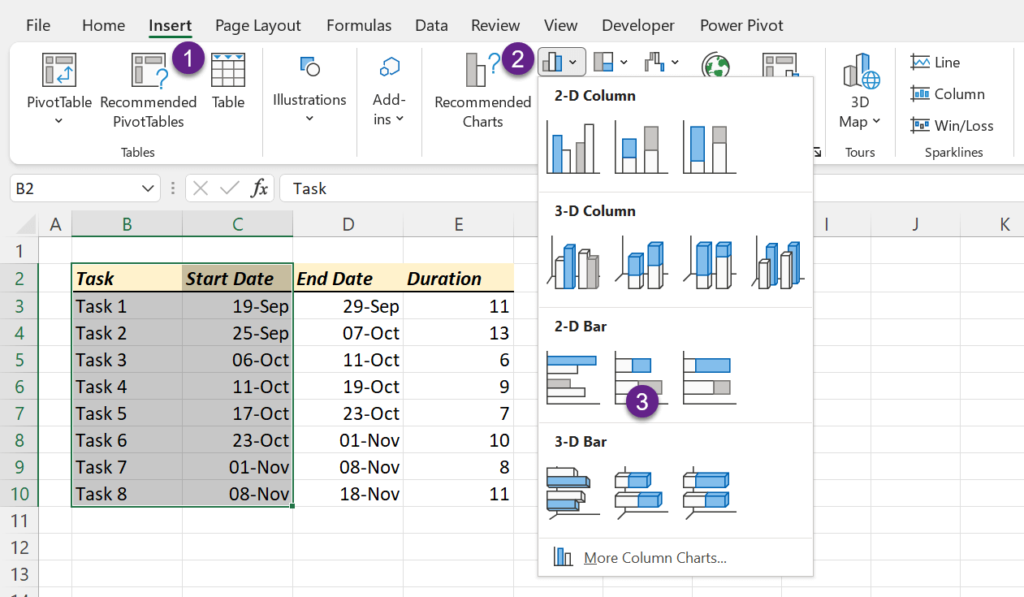
Select the Task and Start Date columns and go to Insert → Bar Chart → Stacked Bar.
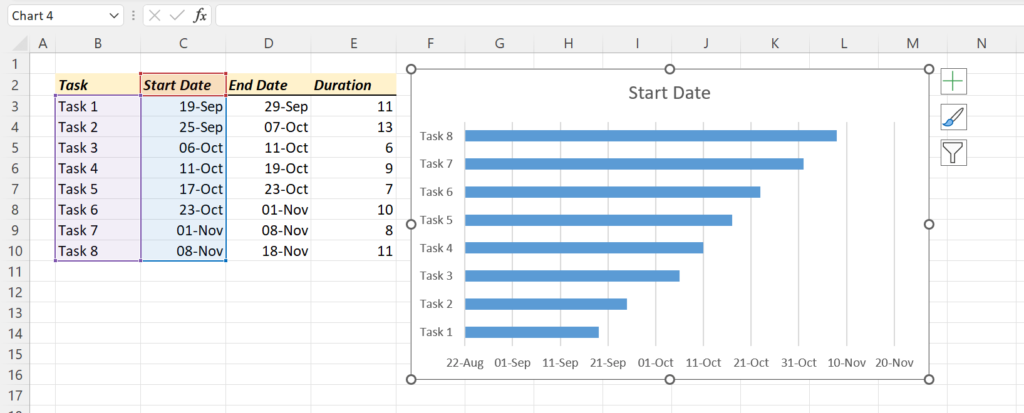
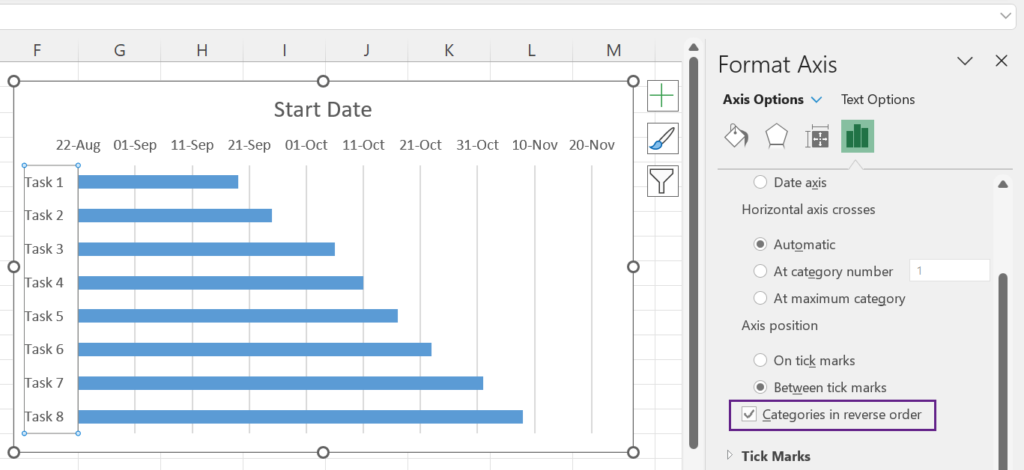
The tasks appear upside down. Right-click the task labels → Format Axis → tick Categories in reverse order.
Step 3: Add the durations
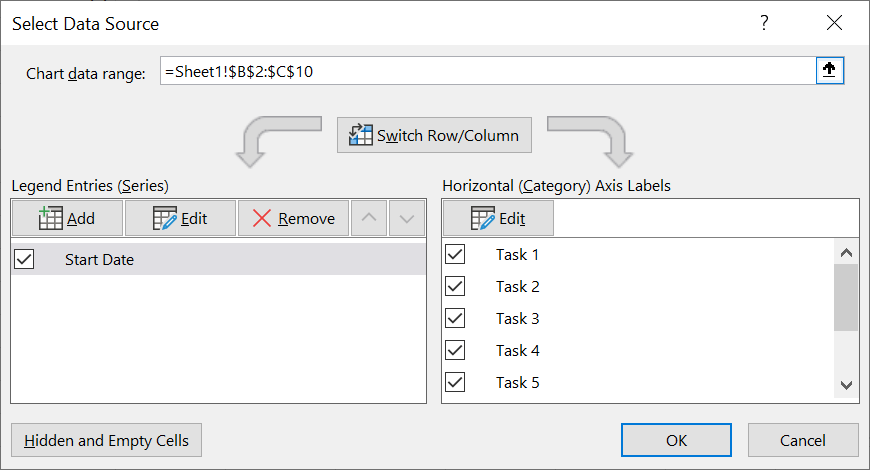
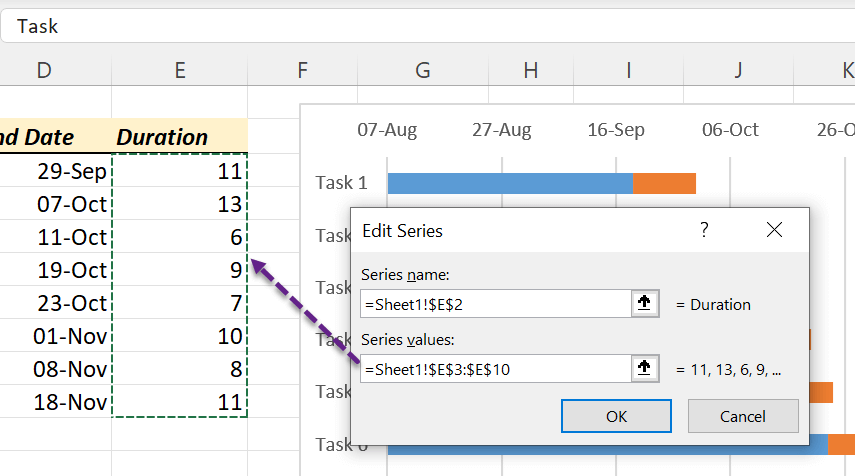
Right-click the chart → Select Data → Add. Use the Duration header for the series name and the duration cells for the values.
Step 4: Hide the start bars
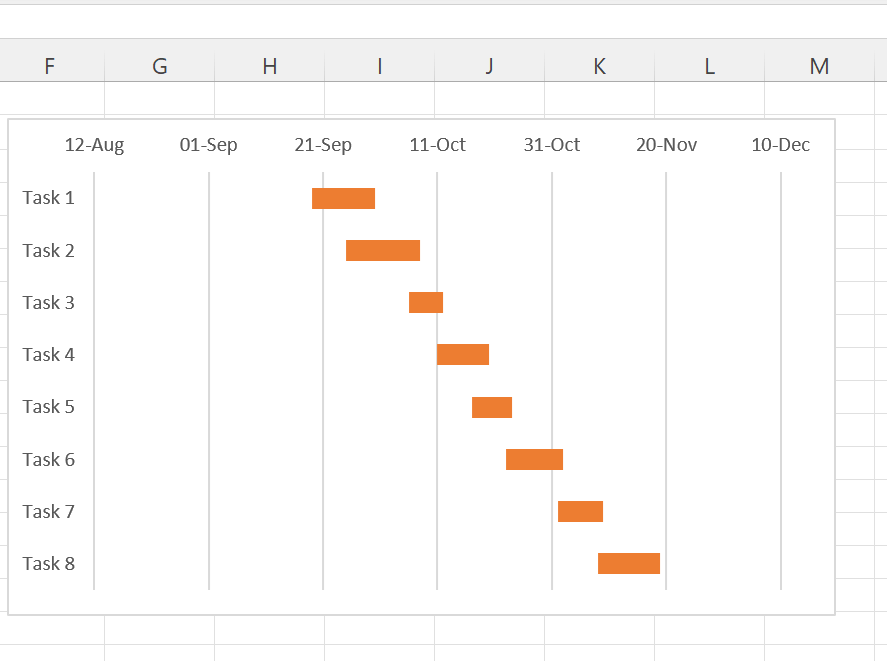
Click any blue (start date) bar and set Fill → No Fill. Only the duration bars remain, each starting on its task’s start date.
Step 5: Fit the date axis
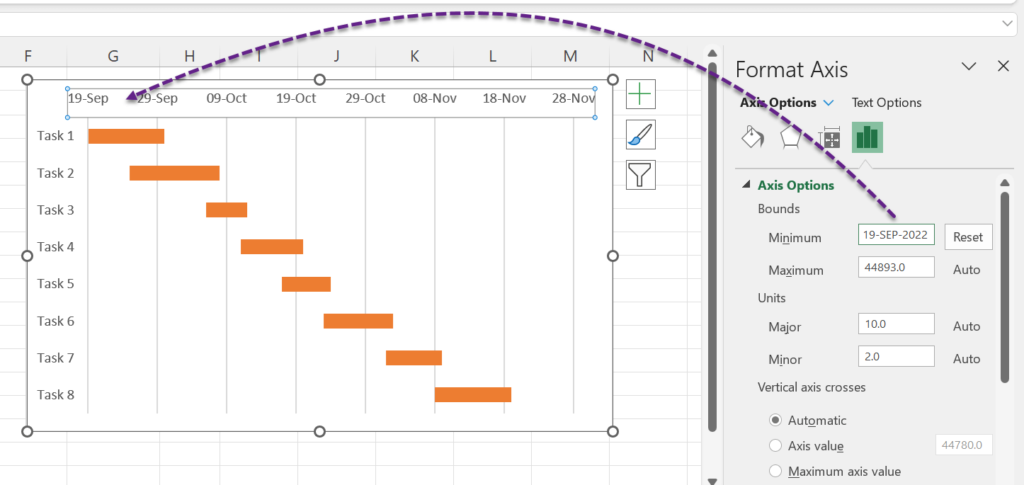
Right-click the dates along the top → Format Axis. Set Minimum to the project start date and Maximum to the end date. Type them as dates; Excel converts them to numbers.
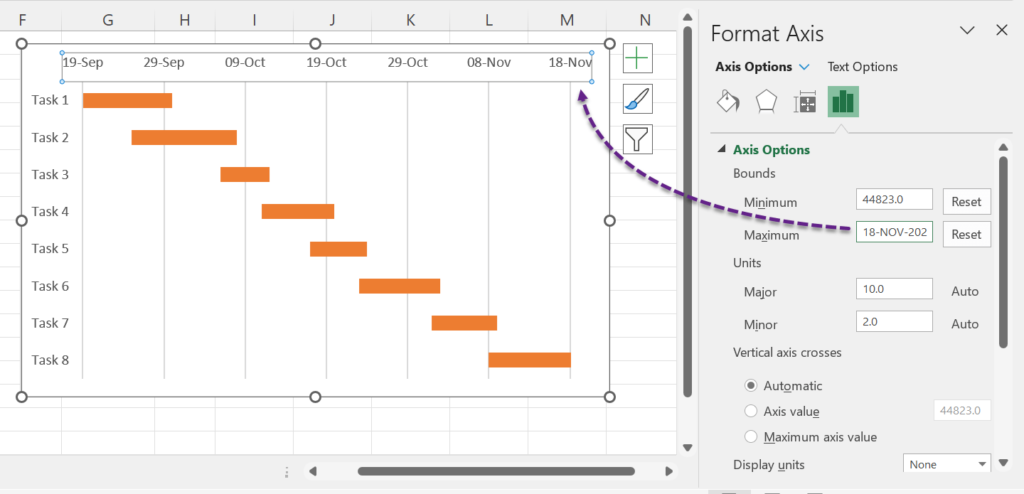
Set Major units to 7 for weekly gridlines.
Step 6: Labels and colours
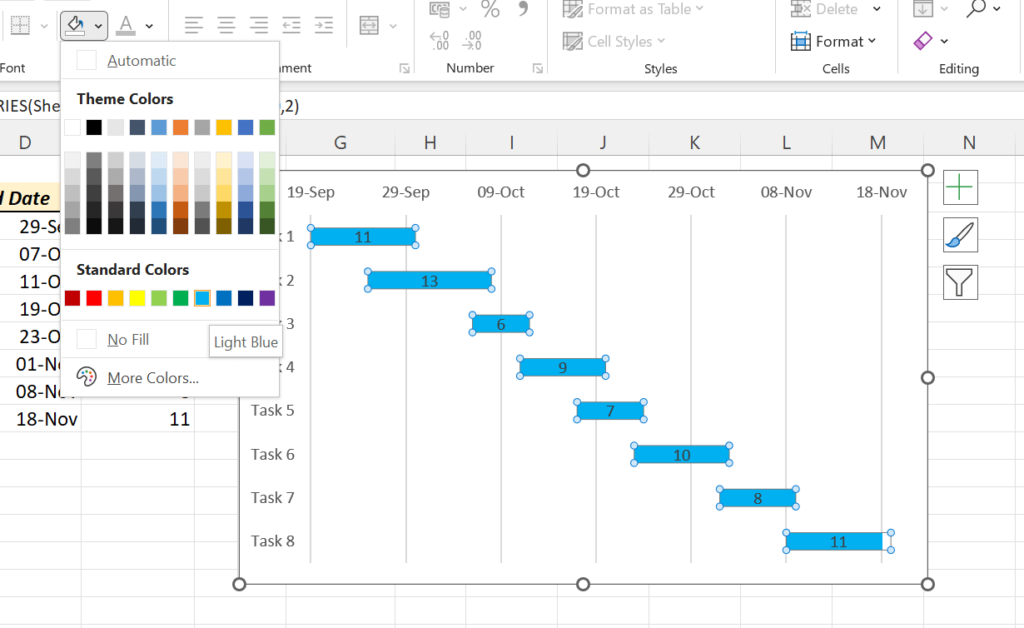
Right-click the bars → Add Data Labels to show the duration, and change the fill colour as you like.
Tips
- Turn the task list into an Excel Table (Ctrl + T) so new tasks join the chart automatically.
- To count working days only, use
=NETWORKDAYS(C3,D3)for the duration label, but keep calendar days for the bar length. - For a quick in-cell version, use conditional formatting on a grid of dates: shade a cell when its date is between the task’s start and end.
Just need the number? Use the working days calculator on Quick Easy Calculators, our sister site, to count the working days in a task.