Four different types of Actual vs Target Charts in Excel
In this article, we will see how to create different types of Actual vs Target Charts in Excel
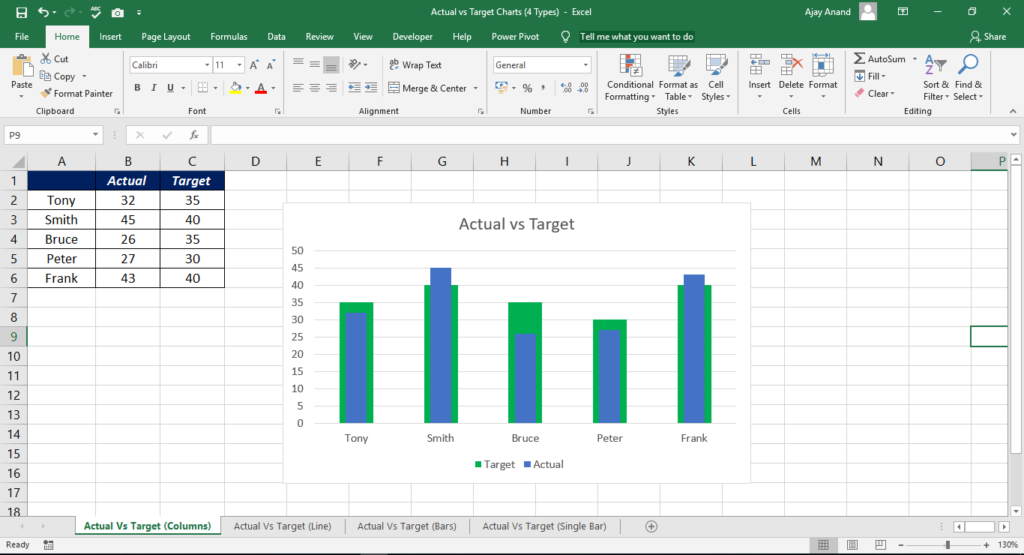
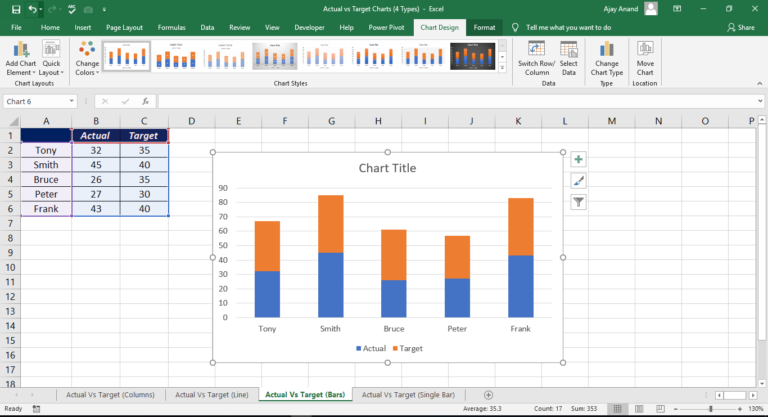
Type 1 (Stacked Columns)
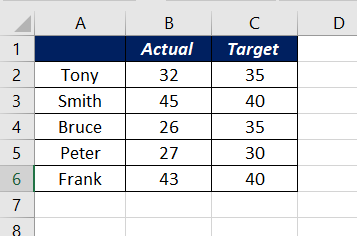
To create an Actual vs Target chart from the data given below
Select the data
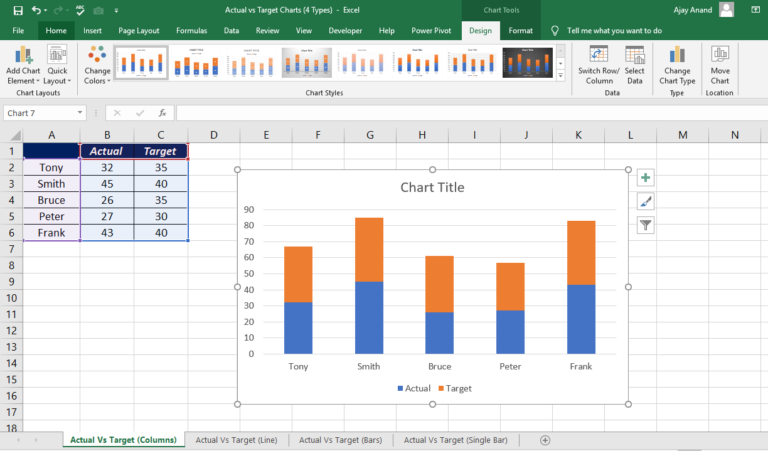
Go to Insert Tab > Click on the Icon for insert Column or Bar chart
Select Stacked Column from the available options
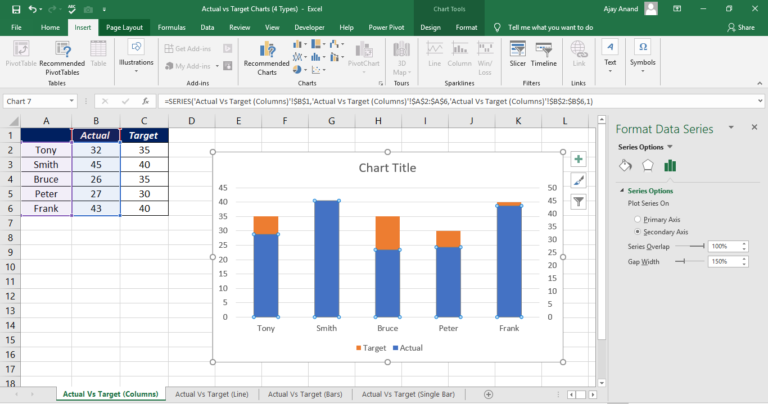
Right Click on the bars representing the actual values (blue in this case) and select Format Data series
Select the radio button for Secondary Axis under series options
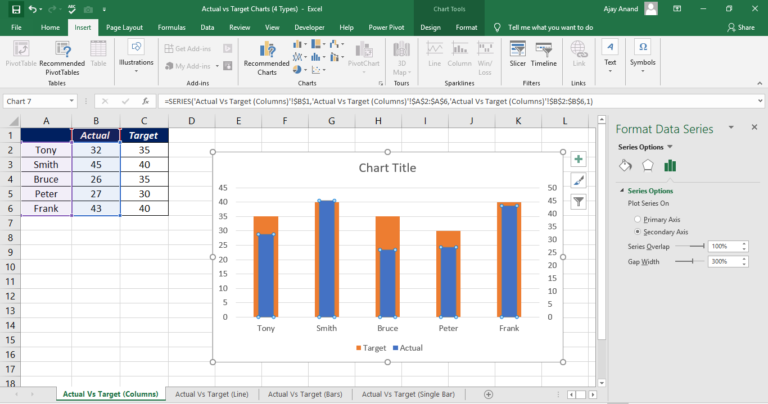
Modify the value of Gap Width to 300%
Delete the data label for Secondary Axis
Use the fill color option to change the color of the bars
—–
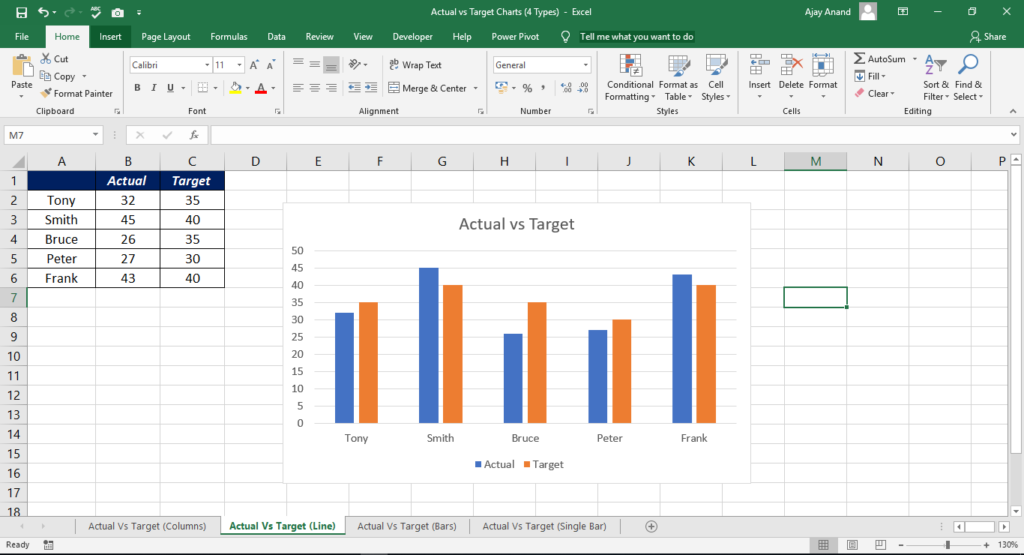
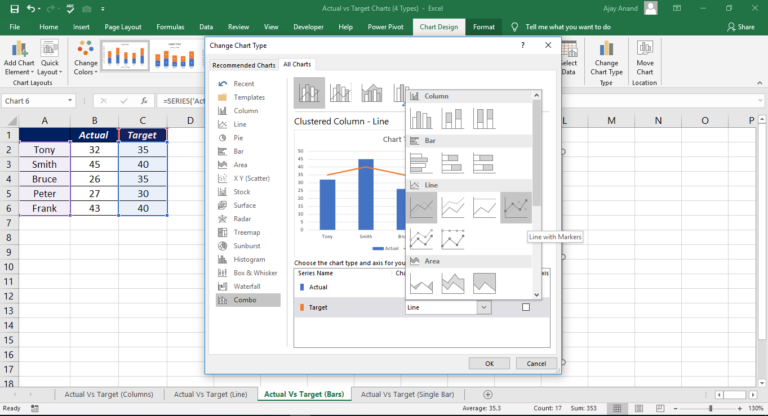
Type 2 (Combo Chart, Column Line)
Select the data
Go to Insert Tab > Click on the Icon for insert Column or Bar chart
Select Clustered Column or Stacked Column from the available options
Click on the bars representing the Target values (Orange in this case)
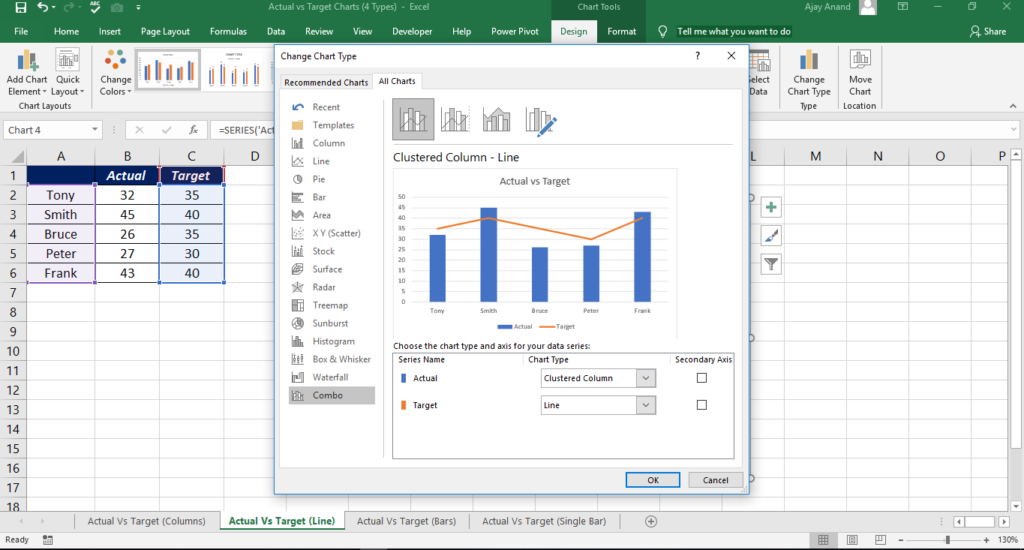
Click on Change Chart Type button in the Design Tab to activate dialog box for changing chart type
By default, Combo option will be selected
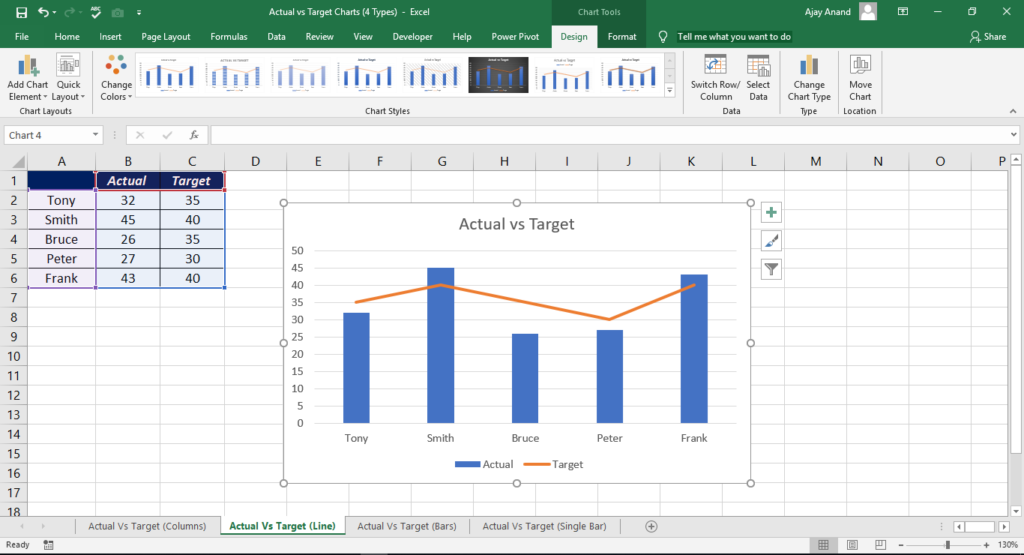
Select Clustered Column – Line Chart type and Click OK
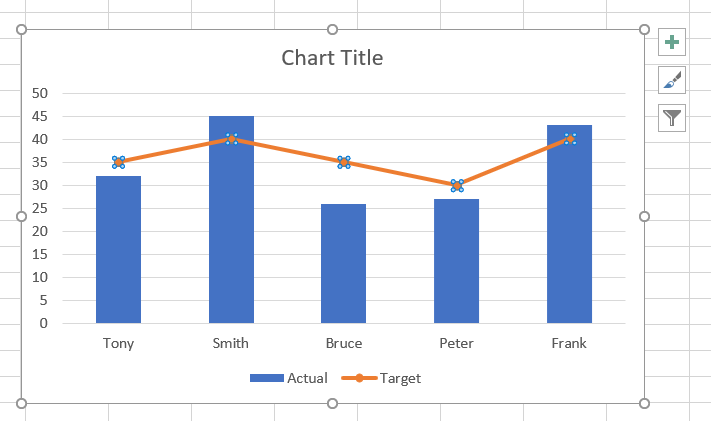
Type 3
Select the data
Go to Insert Tab > Click on the Icon for insert Column or Bar chart
Select the Clustered Column or Stacked Column from the available options. Here I am going for stacked columns
Click on the bars representing the Target values (Orange in this case)
Click on Change Chart Type button in the Design Tab to activate dialog box for changing chart type
By default, Combo option will be selected
Select Clustered Column – Line Chart type
In the box below, we will have an option Choose the chart type and axis for the data series
From the drop down menu against Target, select the option line with markers and click Ok
We will have a combo chart with column and line with markers
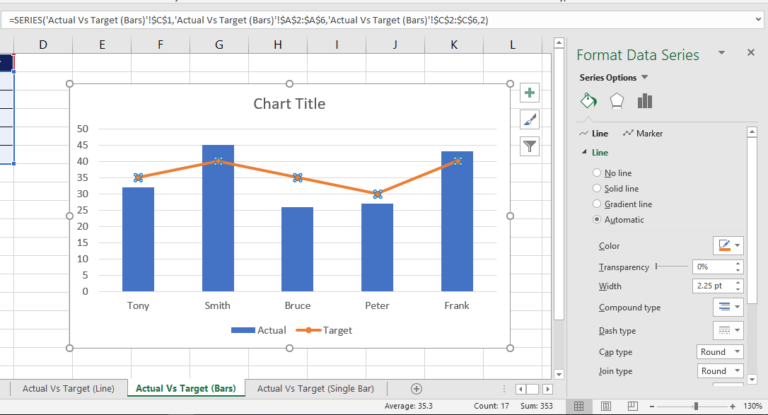
Select the line, right click and select Format Data Series
Select Fill & Line under Series Options
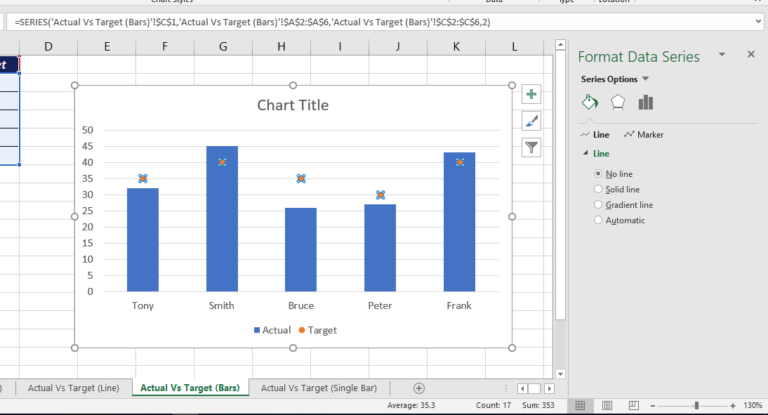
Click on the radio button for No Line
The line will disappear and leaving the markers
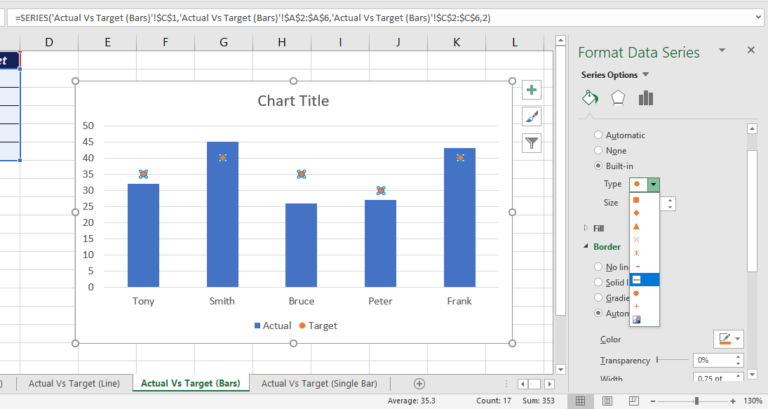
Select the Marker Options > Click on the radio button against Built in
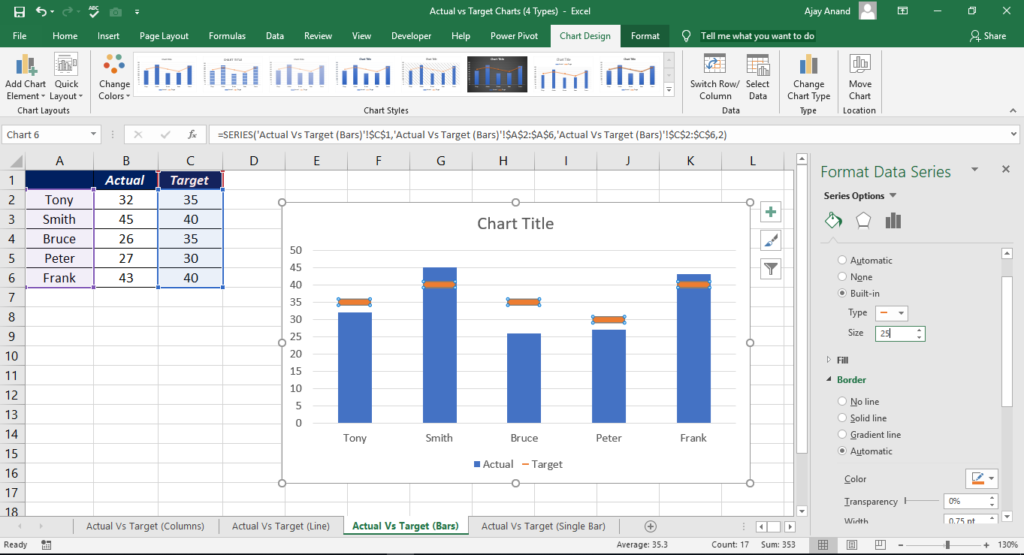
This action will activate the Built in option which has two options – Type and Size. From the drop down menu against Type, select bar and change the size to 25