In the second week of June 2020, Microsoft introduced a new Excel Function called STOCKHISTORY, with which we can pull the Historical data of Stocks Prices and Currency exchange rates into an Excel worksheet.
Note: At present, STOCKHISTORY function is available only to the 50% of Microsoft 365 Subscribers in the Beta level of the Office Insider program
Table of Contents
Technical Details
Syntax
=STOCKHISTORY(stock, start_date, [end_date], [interval], [headers], [property1], ...)
Arguments
stock – The identifier for the financial instrument. This can be a Stock or Currency ticker symbol or a Stocks data type. For the share price of ‘Gail India Limited’ (GAIL) trading in ‘National Stock Exchange’ (NSE) of India, the first argument should be “XNSE:GAIL”
start_date – The earliest date for which data is to be retrieved
end_date – [optional] The latest date for which data is to be retrieved. Default value is current date
interval – [optional] 0 for daily, 1 for weekly and 2 for monthly data. Default value is 0
headers – [optional] 0 to display data with headers, 1 for data without headers, 2 to display data with headers and the financial instrument identifier
property0 to property5 – These optional arguments can be used to specify the information to be returned. Default values are 0, 1 (Date and Closing price). Following are the values that can be used and the information returned.
| Value | Property | Definition |
|---|---|---|
| 0 | Date | Date of the first valid Trading Day |
| 1 | Close | Closing price |
| 2 | Open | Opening Price |
| 3 | High | Highest Price |
| 4 | Low | Lowest Price |
| 5 | Volume | Traded Volume |
How to use STOCKHISTORY function
Example 1 (with Basic inputs)
To fetch the the closing prices of Amazon.com, Inc. in the NASDAQ stock market on every trading day starting from 01/06/2020 up to the 15/06/2020, use the following formula
=STOCKHISTORY("AMZN","01/06/2020","15/06/2020")
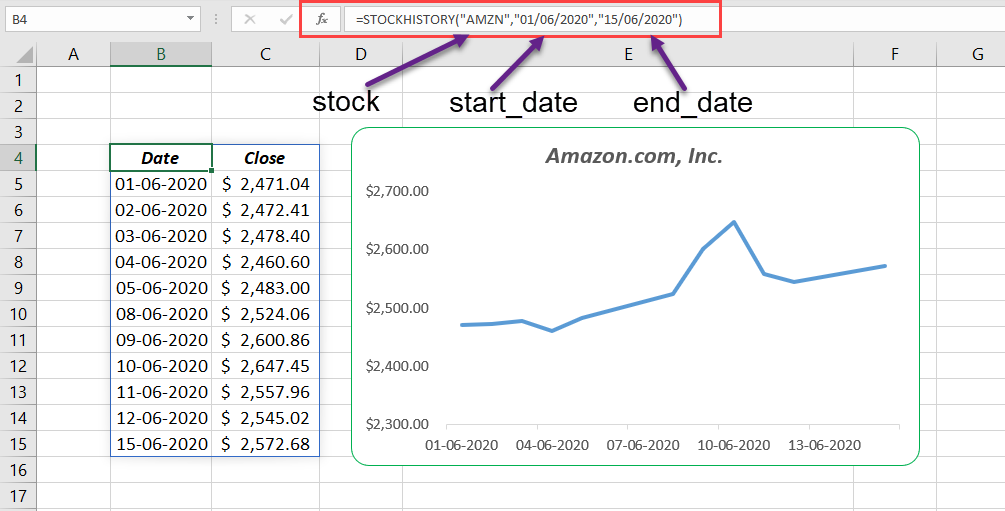
In the above formula,
“AMZN” is the ticker symbol corresponding to Amazon.com, Inc., ’01/06/2020′ is the start_date and ’15/06/2020′ is the end_date.
There are 11 valid trading days between ’01/06/2020’and ’15/06/2020′ and function returned the data corresponding to those 11 days.
Example 2 (Data from NSE, National Stock Exchange of India)
NASDAQ is the default stock exchange for STOCKHISTORY function. If the ticker symbol corresponding to the financial argument is specified without a ‘Market Identifier Code’, values will default to XNAS (NASDAQ) stock exchange.
So, to fetch data from a particular stock exchange, we have to either specify the corresponding Market Identifier Code before the Stock name or convert the stock name into a Stocks Data Type.
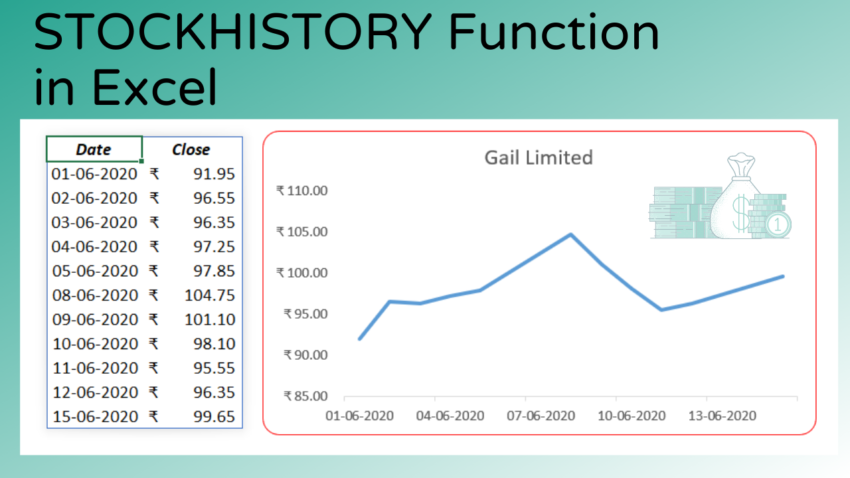
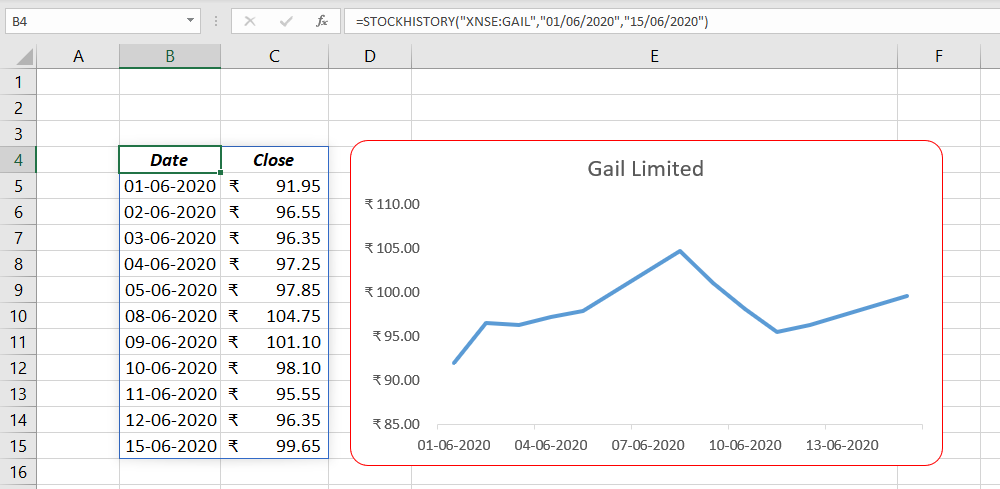
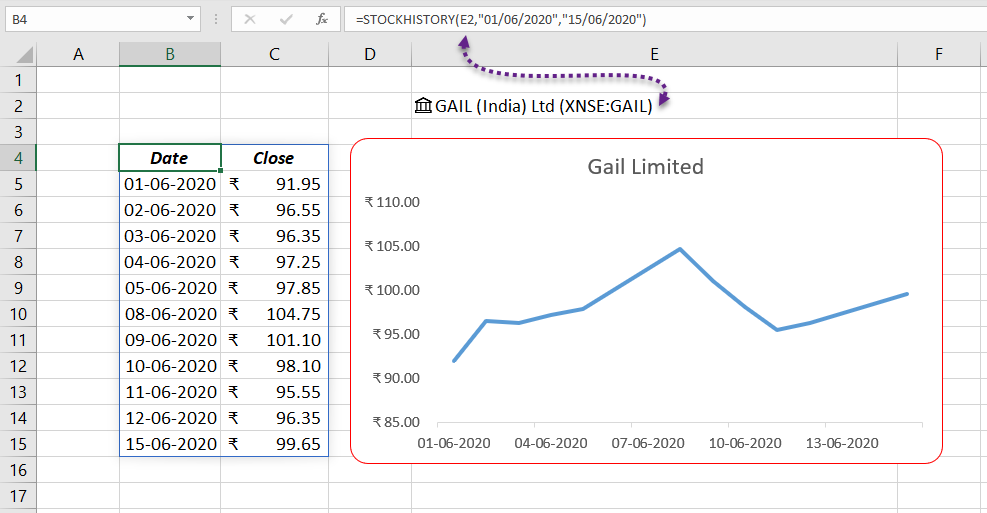
XNSE is the Market Identifier Code for National Stock Exchange (NSE) of India. For the share prices of ‘Gail Limited’ in NSE for a period from 01/06/2020 to 15/07/2020,
=STOCKHISTORY("XNSE:GAIL","01/06/2020","15/06/2020")
Another way to do this is converting the text GAIL into the corresponding Stock Data Type.
I have converted the data in the cell E2 into a Stock Data Type and the cell reference E2 is used in STOCKHISTORY function to produce the same result.
=STOCKHISTORY(E2,"01/06/2020","15/06/2020")
Example 3 (Daily, Weekly and Monthly data)
The fourth argument of STOCKSHISTORY function can be used to specify the interval between the retrieved data. This argument accepts any of the three values ‘0’, ‘1’ and ‘2’ for ‘Daily’, ‘Weekly’ and ‘Monthly’ data respectively.
Note that the default value of this argument is ‘0’. If we leave this argument as blank, STOCKHISTORY function will return the daily data.
For the daily stock prices of Cipla Ltd in NSE from 01/01/2020 to 30/06/2020
=STOCKHISTORY(C2,C3,C4,0)
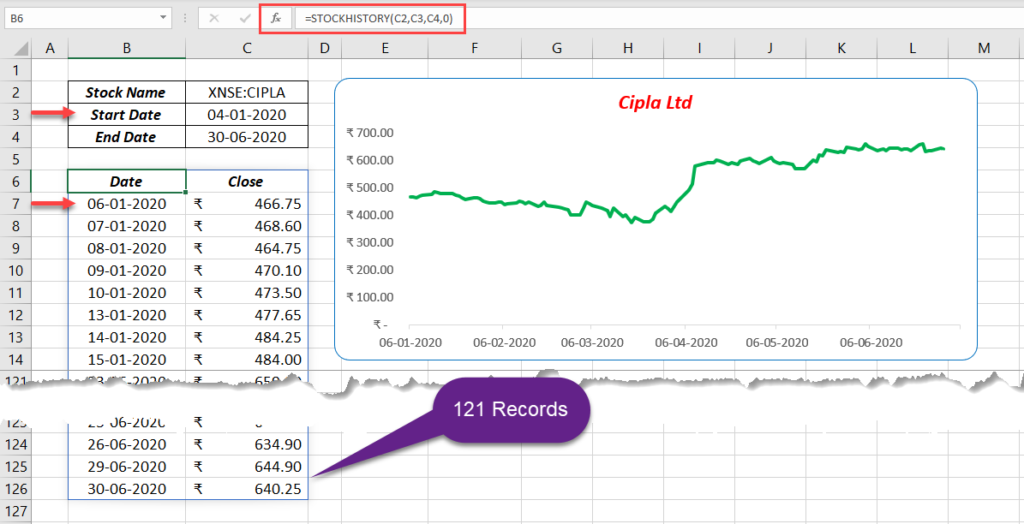
The above formula has returned the closing prices of Cipla Ltd for 121 trading days from 01/01/2020 to 30/06/2020. Even if, the start_date is 04/01/2020, records start from 06/01/2020. This is because 04/01/2020 is a holiday and next valid trading day is 06/01/2020.
For the weekly data, use the value 1 as the 4th argument.
=STOCKHISTORY(C2,C3,C4,1)
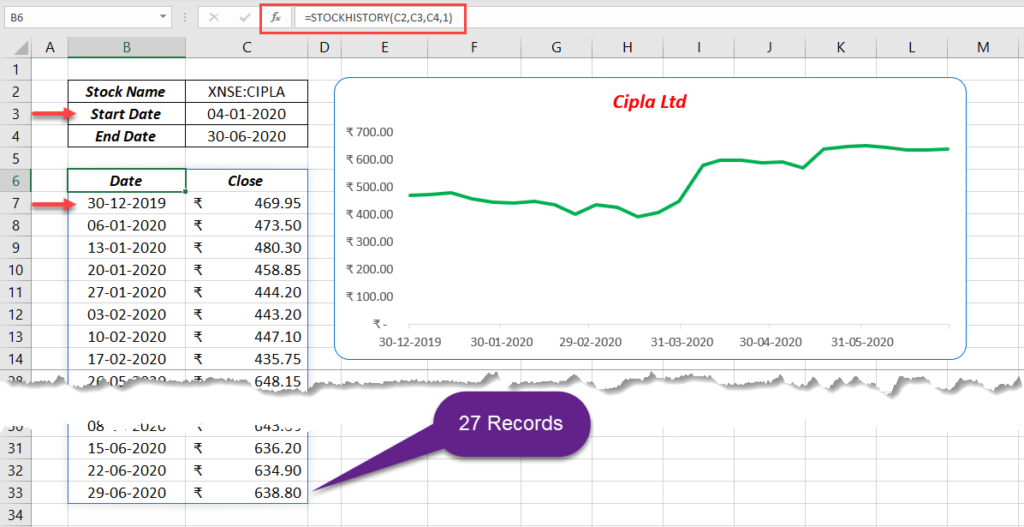
The above formula has returned the closing prices of Cipla Ltd for 27 trading days from 30/12/2019 to 30/06/2020. When we choose weekly interval, STOCKHISTORY function returns the closing prices from the first valid trading day of every week that falls in the specified time period.
For monthly data,
=STOCKHISTORY(C2,C3,C4,2)
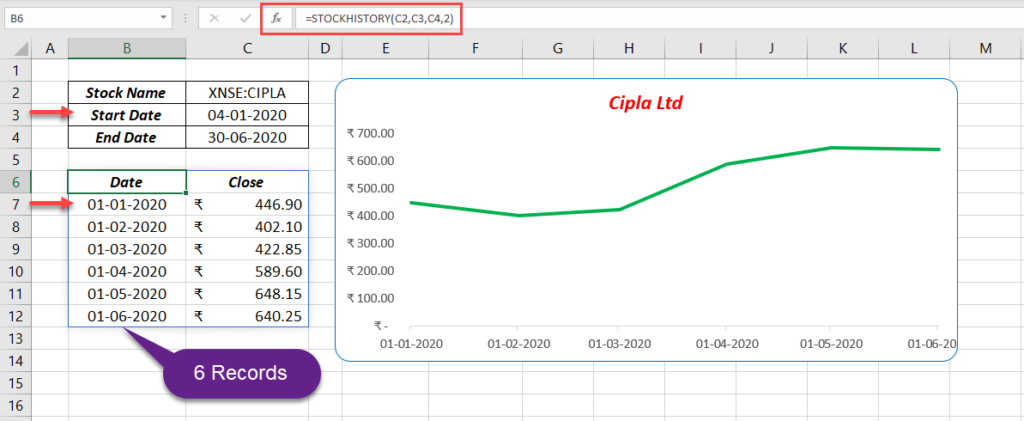
The above formula has returned the closing prices of Cipla Ltd for 6 days (beginning of every month) from 01/12/2019 to 01/06/2020.
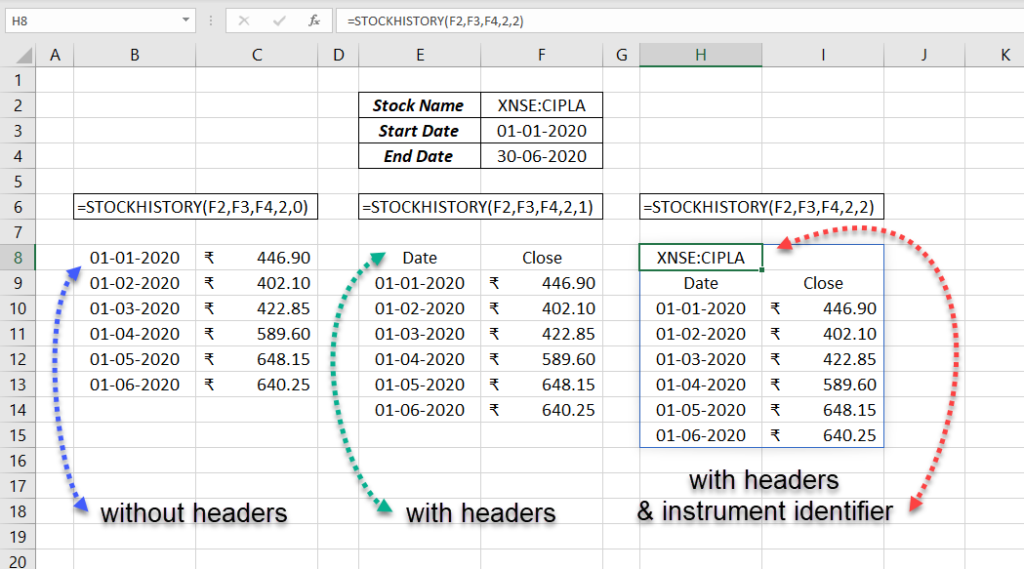
Example 4 (with or without headers )
The fifth argument of STOCKHISTORY function can be used to choose whether the output data need headers or not. This argument accepts any of the 3 values ‘0’, ‘1’ and ‘2’ for ‘with headers’, ‘without headers’ and ‘with headers and instrument identifier’.
Following is an example of different outputs created by changing the value for headers
Example 5
The STOCKHISTORY function can return a maximum of 6 different values against every date in the specified time period. These values otherwise called properties are ‘Date’, ‘Closing Value’, ‘Opening Value’, ‘Day’s High’, ‘Day’s Low’ and ‘Traded Volume’ and the numbers from ‘1 to 5’ are the corresponding codes for these properties. Refer the table under the section Arguments.
Using the corresponding code for each property or value, we can decide whether to display that particular value or not. We can also arrange these codes in the order we like.
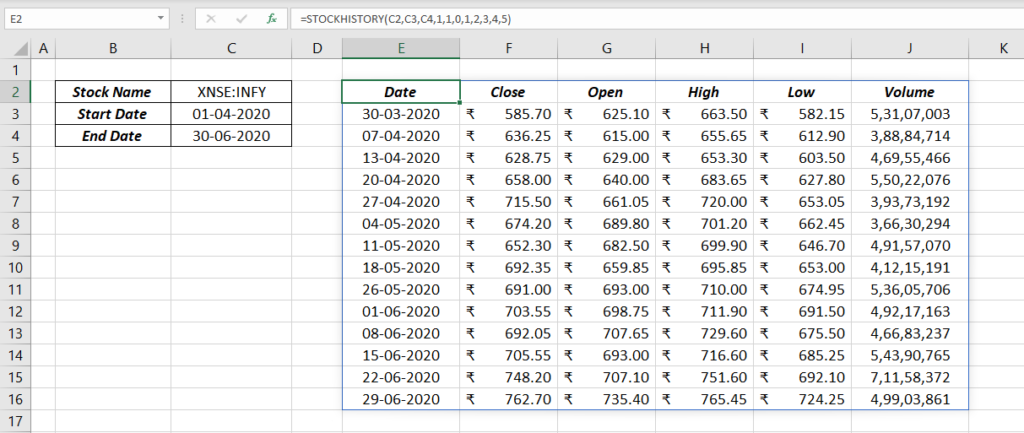
The following formula will return the weekly data for Date, Closing Value, Opening Value, Day’s High, Day’s Low and Traded Volume for Infosys Ltd from 01/04/2020 to 30/06/2020.
=STOCKHISTORY(C2,C3,C4,1,1,0,1,2,3,4,5)
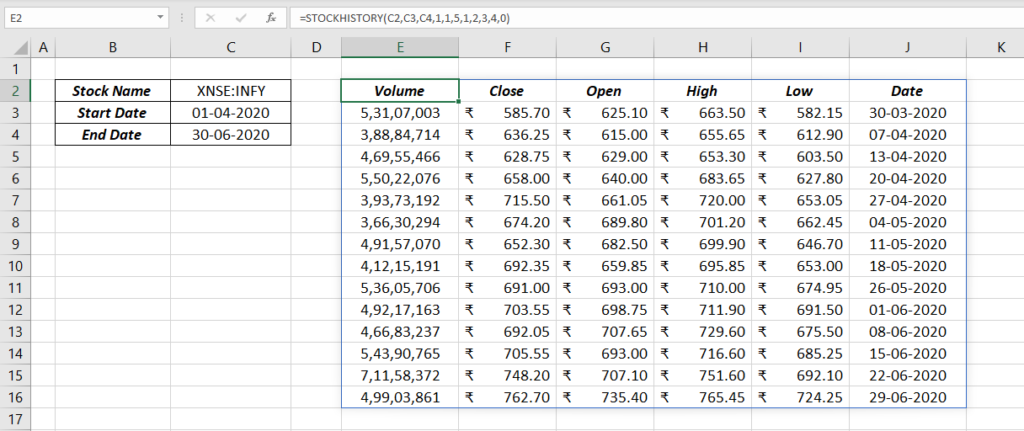
To rearrange the properties in the order of Volume, Closing Value, Opening Value, Day’s High, Day’s Low and Date,
=STOCKHISTORY(C2,C3,C4,1,1,5,1,0)
Currency Exchange Rate
STOCKHISTORY function can also return the historical data of currency exchange rates including Bitcoin.
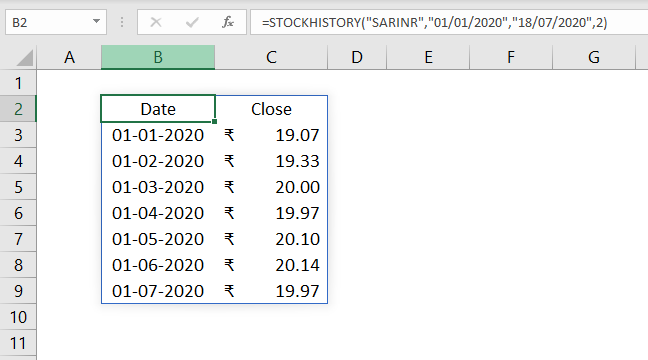
To fetch the historical data of currency exchange rates, use the corresponding ticker symbol as the first argument of STOCKHISTORY function.
For example, SARINR is the ticker for converting Saudi Riyal to Indian Rupees.
=STOCKHISTORY("SARINR","01/01/2020","18/07/2020",2)
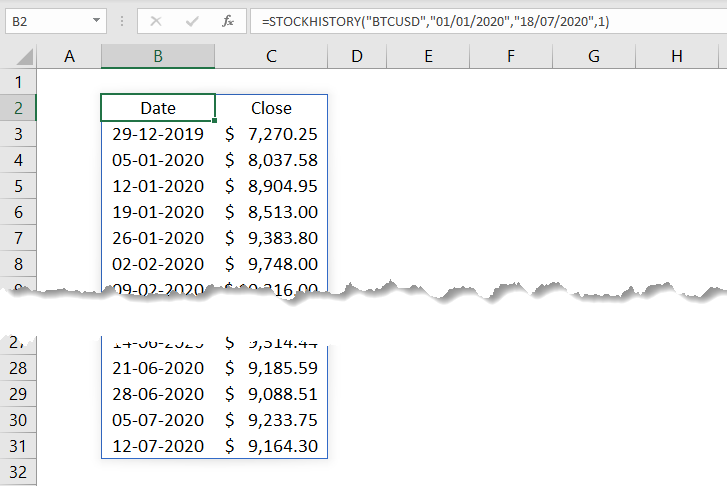
For Bitcoin to US Dollars, use BTCUSD as ticker.
=STOCKHISTORY("BTCUSD","01/01/2020","18/07/2020",1)
You can also use a hyphen (-) or a forward slash (/) in between the codes for a better understanding.
Formatted Number Values (FNVs)
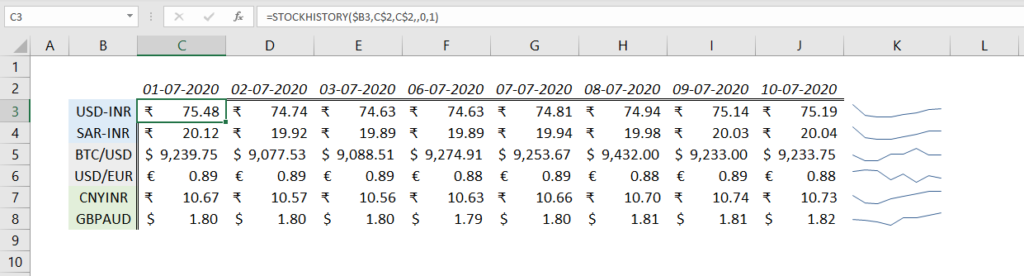
In the following example, when I change the ticker, the currency symbol also changes accordingly. For SARINR and USDINR, currency symbol is ₹ and for BTCUSD, currency symbol is $.
Similarly, when I use a stock listed in NASDAQ, the prices are returned in U.S Dollars, accompanied with ($) Dollar sign. At the same time when I use a stock from NSE, the prices are returned in Indian Rupees with (₹) Rupee symbol. FNVs makes this possible.
The numbers returned by STOCKHISTORY function uses an enhanced number type called Formatted Number Value (FNV) which gives formatting hints about the returned numbers. Even if the cells are in General format, numbers will be automatically formatted as Date, Currency, Number etc.
STOCKHISTORY function is first Excel function to use FNVs.
#BUSY! and #BLOCKED!
In connection with the new STOCKHISTORY function, 2 new errors #BUSY! and #BLOCKED! have been introduced into Excel.
#BUSY! says, Excel is busy collecting the data and this error disappears quickly.
#BLOCKED! error appears when the data, we are trying to retrieve is not available.
Read about Formula Errors in Excel
Excel Functions in Alphabetical Order (Complete list)
Complete List of Excel Functions (Category wise)