Table of Contents
How to Access or Activate the Power Query Editor
Power Query Editor is where we can Transform or Shape our data using Queries and there are 3 ways to access it.
1. Launch the Power Query Editor using the Get Data button in Data tab of Excel Ribbon,
2. Load data into Power Query Editor using different options in the Get & Transform group
3. Edit an Existing Query
User Interface of Power Query
Following is the User Interface of Power Query also know as Power Query Editor and there are 7 major parts to it.
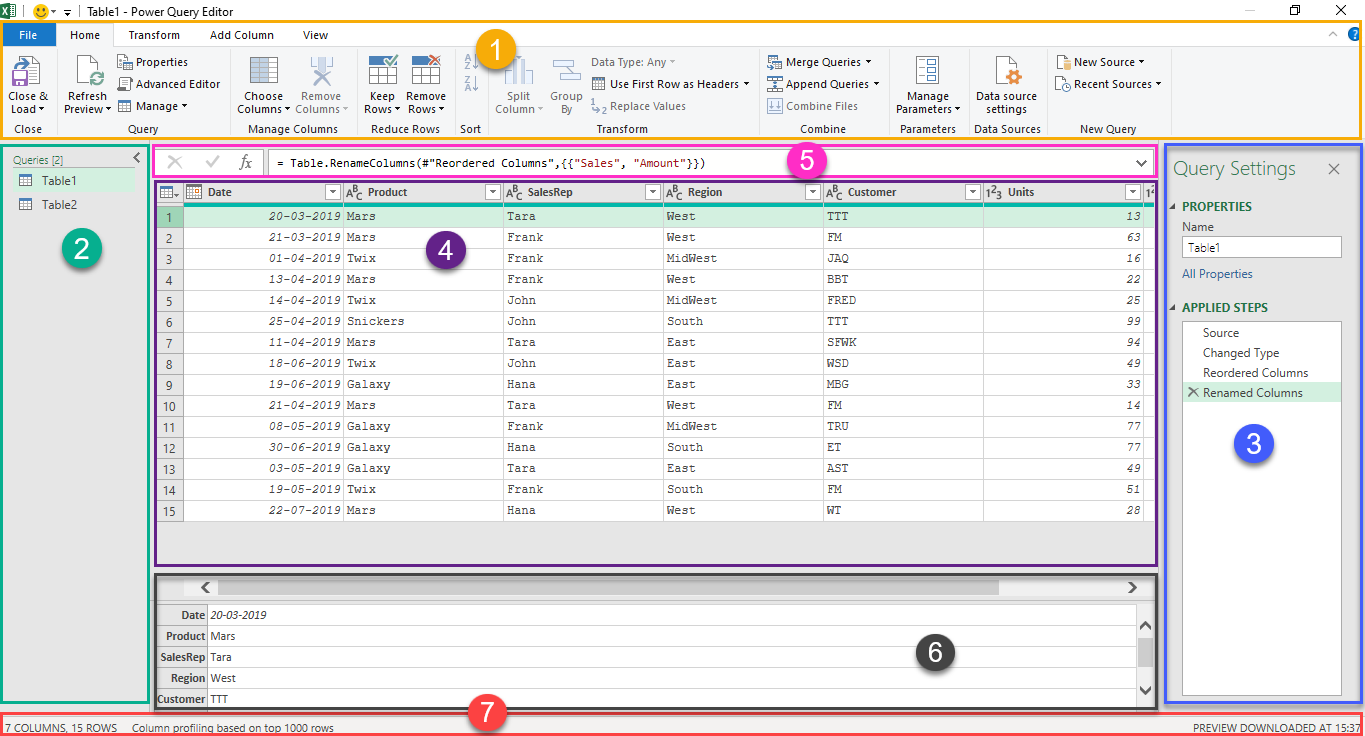
1. Query Editor Ribbon – Query Editor Ribbon is similar to the Excel Ribbon and has 5 Tabs in it. The different data transformation options available with Power Query are arranged in these tabs called File, Home, Transform, Add Column and View. We will explore these tabs in detail, later in this page.
2. Queries – This pane lists the Queries, Tables and Custom Functions present in a workbook. Using this pane we can Rename, Duplicate or Navigate to different queries or tables in the current workbook.
3. Applied Steps/Query Settings – Each transformation step applied to the data will be listed in their chronological order in this pane. We can Rename, Delete or Reorder a Transformation Step or Steps using this pane. When we select a particular step on this pane, the result of that applied step will be displayed in the Preview Grid.
4. Preview Grid/Data Pane – This area displays the preview of data at each applied step of a Query. We can also access different transformation options from the Column Header or Individual cell by right-clicking on them.
Note that, even if the Preview Grid looks similar to the workspace of Excel, we won’t be able to edit the data present in individual cells using this pane.
5. Formula Bar – Each transformation step in a Query will have a corresponding M Code. When we select a particular applied step from the Applied Steps Pane, corresponding M Code will be displayed in the Formula bar. We can edit or modify the code using this Formula bar.
The following sections are information providers.
A – Displays a preview of the selected row or cell.
B – Displays the summary of data loaded into the editor, Total number of rows and columns.
Different Tabs of the Power Query Editor
All ETL options available in Power Query are arranged in different tabs according to their use and nature. Interestingly, some options can be seen at multiple tabs of the Power Query Editor.
Now, let’s see each Tab of Power Query Editor in Detail.
File Tab
The File tab contains the different options for Saving or Discarding the work done in Power Query Editor, Closing the Query Editor and most importantly, Loading the transformed data into the Excel worksheet.
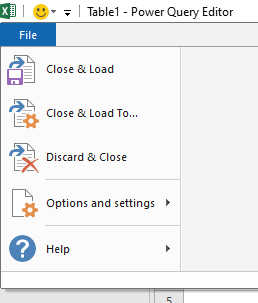
Close & Load – Saves the query or queries and load the transformed data into a New or an Existing worksheet.
Close & Load To… – Saves the query and will activate the Import Data dialog which contains different options to load the data
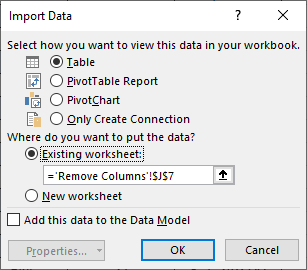
Using the Import Data dialog we can choose whether to load the data into the Existing worksheet as a Table, a Pivot Table Report, a Pivot Chart or only as a Connection.
There is also an option to Add the transformed data into the Data Model, which will make the data available to the Power Pivot Engine of Excel.
Discard & Close – Discards the work done during the current session and close the Query Editor.
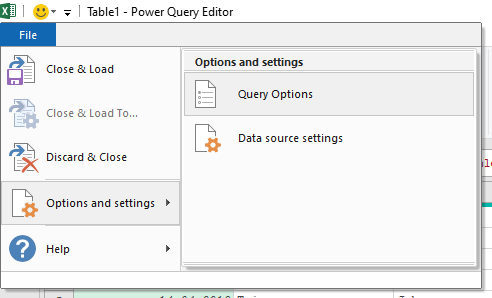
Options & Settings – Contains two options, Queries Options and Data source settings
Home Tab
Like any other ribbon arrangement, the most commonly used options of Power Query are arranged in the Home tab under 10 different groups.
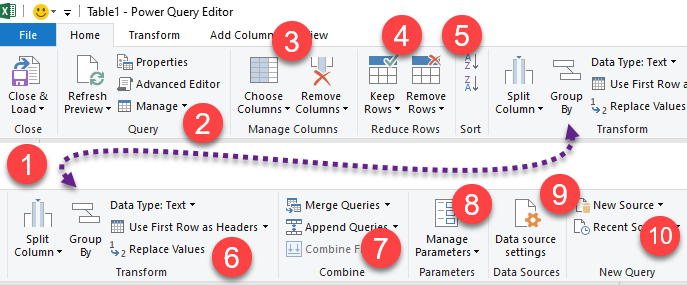
Close – The two options Close & Load and Close & Load to, which are also available in the File tab can be accessed from this group.
Query – Options to Edit, Delete, Duplicate, Rename, Refresh or Reference a Query or Queries are available in this group.
Manage Columns – This group contains the options to Remove or Keep Columns and to Navigate to a particular column.
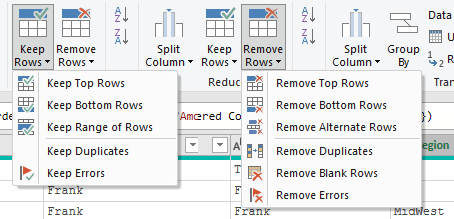
Reduce Rows – There 11 different options in this group using which can manage rows in our data set and they are ‘Keep Top Rows’, ‘Keep Bottom Rows’, ‘Keep Range of Rows’, ‘Keep Errors’, ‘Keep Duplicates’, ‘Remove Top Rows’, ‘Remove Bottom Rows’, ‘Remove Alternate Rows’, ‘Remove Errors’, ‘Remove Duplicates’ and ‘Remove Blank Rows’.
Sort – Data can be sorted in their Ascending/Descending or Alphabetical/Reverse Alphabetical order of values in a column
Transform – There are 5 different Transformation options available in the group.
- Split Column – This option can be used split the data in a column on the basis of a delimiter, number of characters, letter cases, type of characters (digit or non digit).
- Group By – Data can be Grouped and Summarized using this option
- Data Type – To change the Data Type (Text, Number, Date etc.) of a column, use this option.
- Use First Row as Headers – The first Row of a data set can be promoted as Column headers and Column headers can be demoted as the first row using the options available with this split button.
- Replace Values – Numbers, Words or Characters in a column can be replaced with desired values using this option.
Combine – A Query can be combined with another query or queries using the different options like Merge Queries, Merge Queries as New, Append Queries and Append Queries as New
Parameters – Power Query allows to Create and modify parameters which will make the queries dynamic. For example, I have created a query to extract the list of the Top 10 highest grossing movies of 2010, using the link – “https://www.boxofficemojo.com/year/2010/“. By converting the year part (2010) of this query into a parameter we can make the query more dynamic and extract the data for the year of our choice.
Data Sources – Data Source Settings is the only option listed in this group and it deals with permissions to access data from different sources.
New Query – We can create a new query from the different options listed with the split button called New Source. Another split button in the section, Recent Sources lists the links to the recent data sources and we can easily establish a connection with that source by simply selecting it.
Transform Tab
Different Data Transformation options in Power Query are placed in the Transform Tab under 6 groups and are the following
Table – Options present in this group can be used to deal with an entire Table, rather than individual Rows or Columns. We can Group/Summarize data, Transpose the Table, Reverse Rows, Count Rows, Promote First Row as Column header and Demote Column Header as first Row using the options in the Table group.
Any Column – As the name indicates the options in this group can be applied for any type of column (Columns containing Text, Number or Date). We can Move, Rename, Pivot or UnPivot Columns, Change the data type of a column, Convert a column into a list and Fill the blanks of a column using Fill Up/Down options.
Text Column – Options in this group are specifically for columns containing Text data. We can Split or Merge Columns, Convert the Letter cases, Remove spaces or Unprintable characters, Extract characters and Parse XML or JSON objects.
Number Column – If you select a column containing text data, most of the options in the Number Group will be grayed out. This is because options listed in this group are related to Numerical data. The following options under 6 different sections can be used to perform Trigonometric and Arithmetic operations, Aggregations and other Mathematical operations.
- Statistics – Sum, Minimum, Maximum, Median, Average, Standard Deviation and Count
- Standard – Add, Multiply, Divide, Modulo and Percentage
- Scientific – Absolute value, Power, Exponent, Factorial and Square root
- Trigonometry – Sine, Cosine, Tangent, Arcsine, Arccosine and Arctangent
- Rounding – RoundUp and RoundDown
- Information – Is Odd, Is Even and Sign
Date & Time Column – Using the various options listed under Date, Time and Duration in this group, we can extract different details like Age, Day, Month, Year, Quarter, Earliest Date, Latest Date etc. from a column containing Date or Time.
Structured Column – The options Expand, Aggregate and Extract values listed in this group are used to deal with Nested data structures like tables or lists. These options will remain grayed out when you select a column or columns containing ordinary data types like Text, Number or Date.
Difference between Transform Tab and Add Column Tab
Some of the transformation options listed in the Transform Tab can also be found in the Add Column Tab.
The difference between the same options available under these Transform and Add Column tab are, when you use an option from the Transform Tab, it will transform the selected data. But when the same option is used from Add column tab, a copy of the selected data will be created and that data will be transformed. Means, the original data won’t be affected.
Add Column Tab
As the name indicates every transformation option listed in this tab will create a new column.
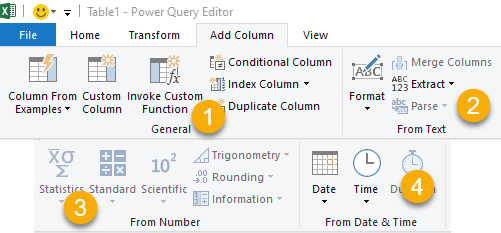
General – The options listed in the General group helps us to Duplicate Columns, Create Index Columns, Create Columns based on conditions and from Examples (works on intellisense like the Flash Fill in Excel). We can also create Columns using Formulas and Functions using the options in this group.
From Text – The options listed in this group are the same, which are listed in the Text Column group of the Transform tab. Difference is, when applied a new column will be created and data in the new column will be transformed.
From Number – Options are the same which are listed in the Number Column group of the Transform tab.
From Date & Time – Same options that are listed in the Date and Time column of the Transform tab.
View Tab
Options for Displaying and Hiding different panes and more are listed in the View tab.
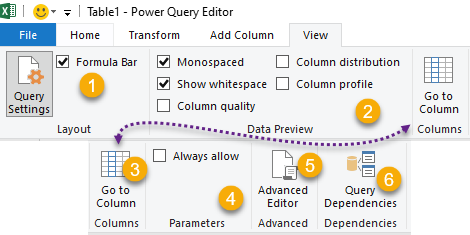
Layout – Options to Hide or Unhide the Formula Bar and Query Settings/Applied Steps are listed in this group.
Data preview – Column Distribution, Column Quality and Column Profile options will gives us an idea about the distribution of values and different data types used in a column.
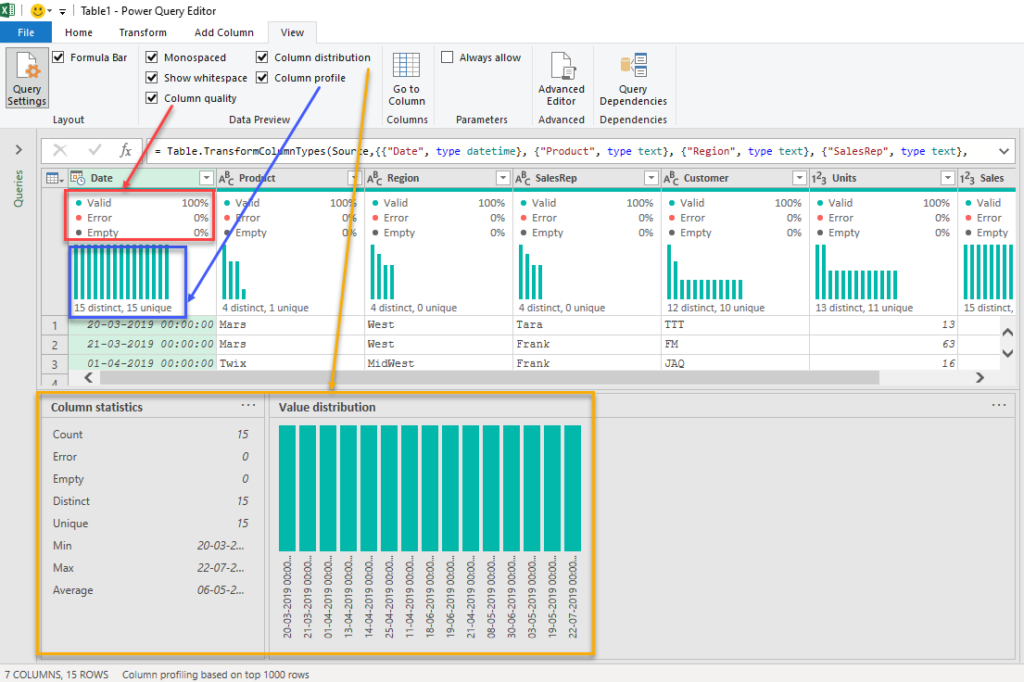
The option ‘Monospaced’ will display the data in monospaced font and the ‘Show whitespace’ option will help us to spot the extra spaces in the data set.
Columns – ‘Go to Column’ option in this group can be used to navigate to a particular column in the data set
Parameters – Mark or Unmark the check box for ‘Always allow’ to allow or block parameterization in data source and transformation dialogs.
Advanced – ‘Advanced Editor’, where we can edit the M Code of queries can be accessed using this option.
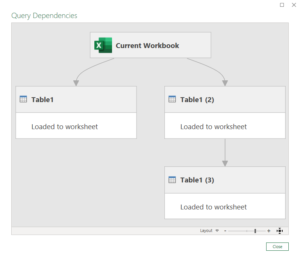
Dependencies – ‘Query Dependencies’ option will provide the Visual representation of queries present in the current workbook and relationships between them.
Watch my Video on 12 Methods to Clean Data using Power Query