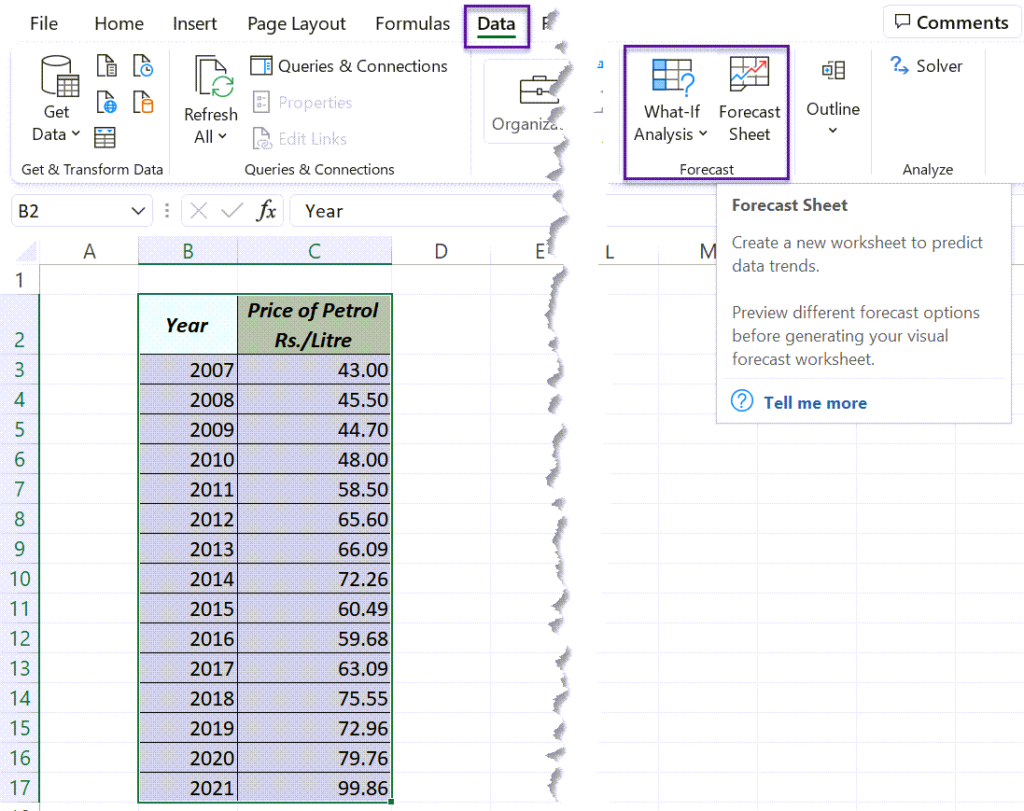
We can create a forecast based on Historical data using the Forecast Sheet option in Excel. This option is available from Excel 2016 and is placed in the Data tab of Excel ribbon
Let’s see how to forecast the price of Petrol in India for the next few years, based on on the historical data (2007 to 2021).
To create a forecast using this data, Select the cells containing data > in the Data tab of the Excel ribbon > click on Forecast sheet
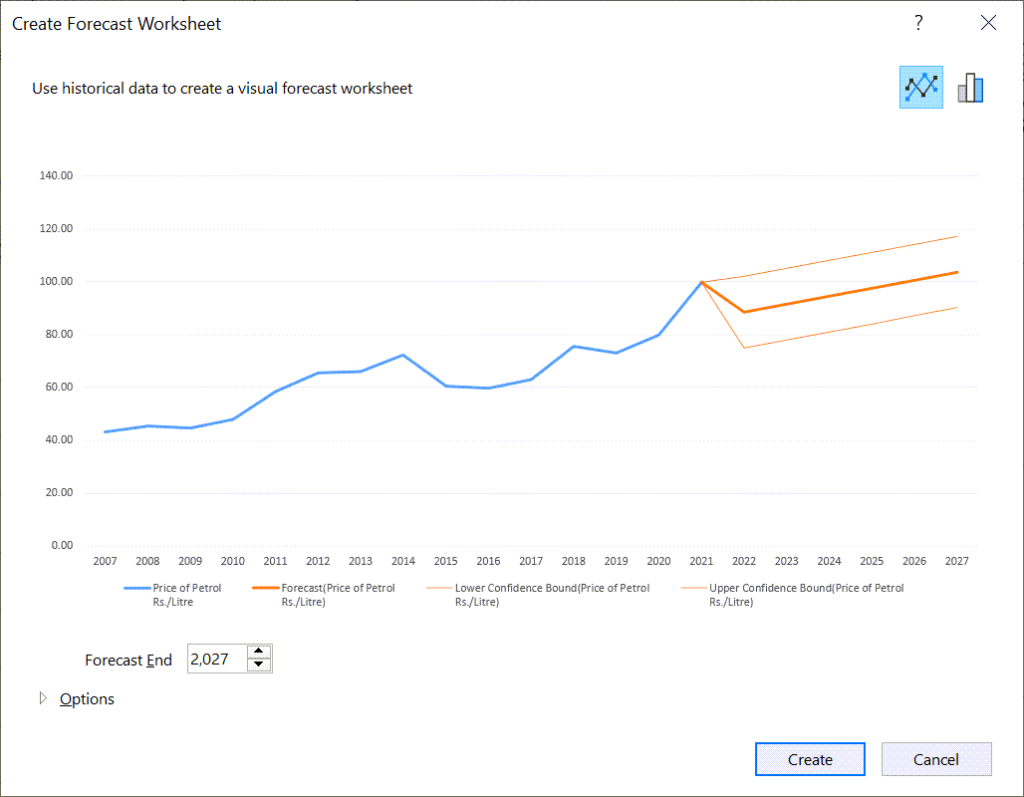
A dialog called Create Forecast Worksheet will be activated.
Using the Split button for Forecast End option, specify the End Year. Here, I have selected 2027 as Forecast End.
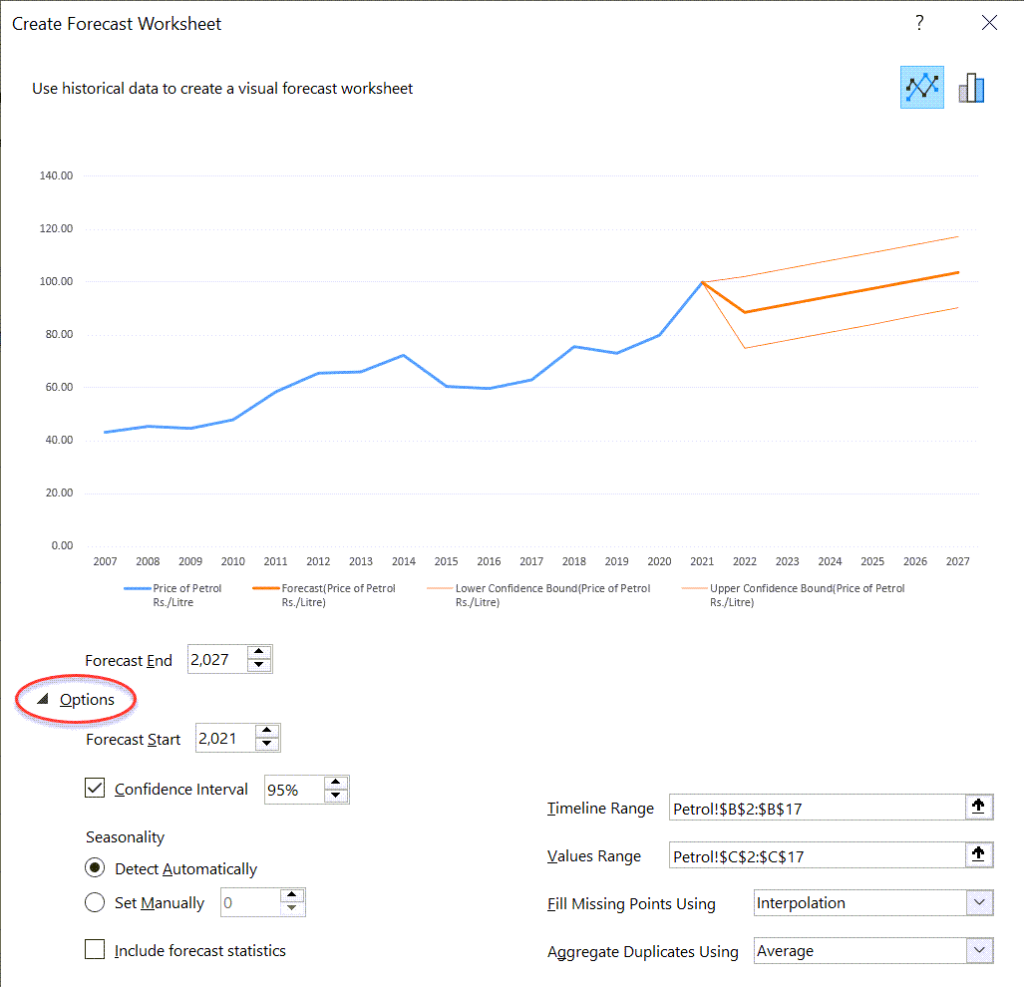
For more control on the parameters (Advanced), click on the Split button called Options.
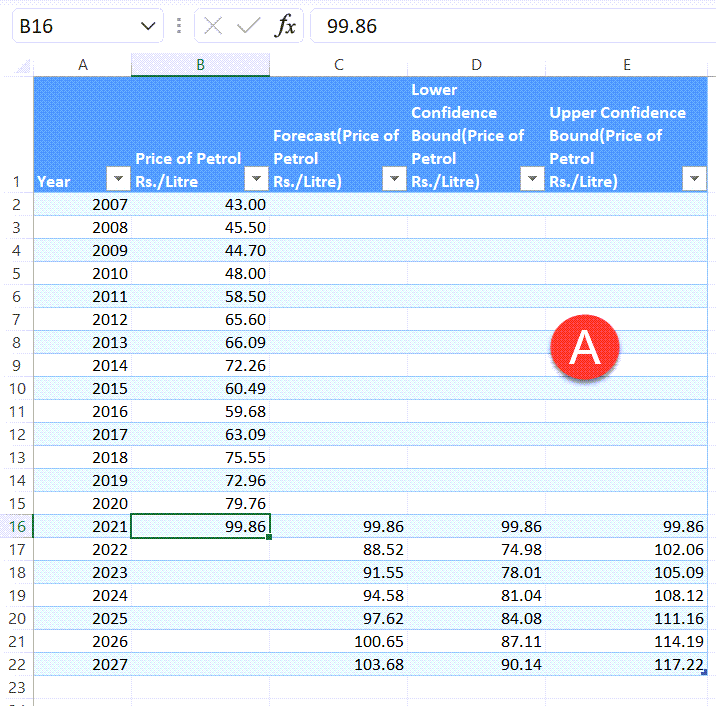
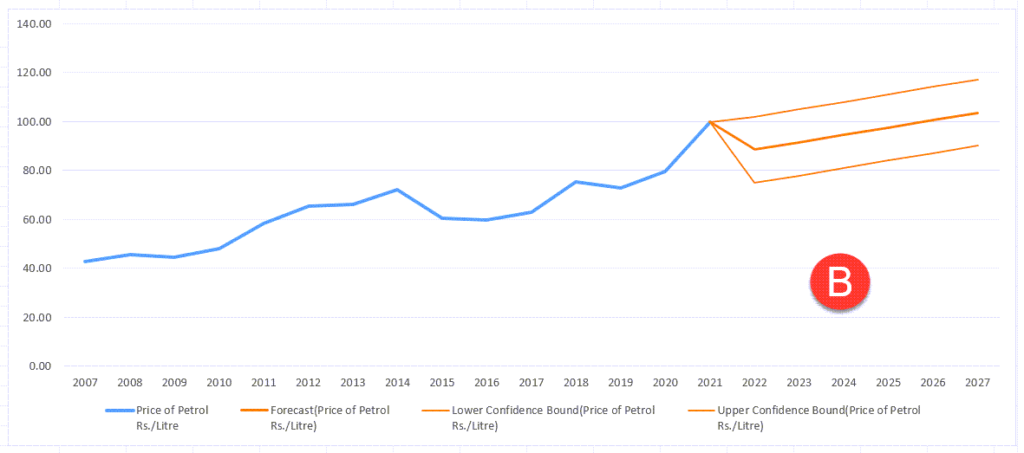
Click on the Create button and Excel will add a new worksheet with a Table containing the historical & predicted data and a Chart corresponding to this data.
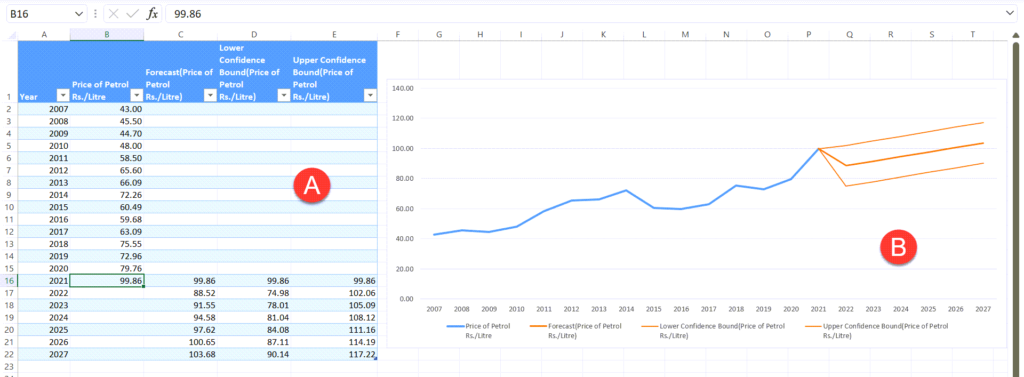
Table with historical and predicted Data (A)
Line Chart with plots of Forecast, Lower Confidence Bound and Upper Confidence Bound (B)
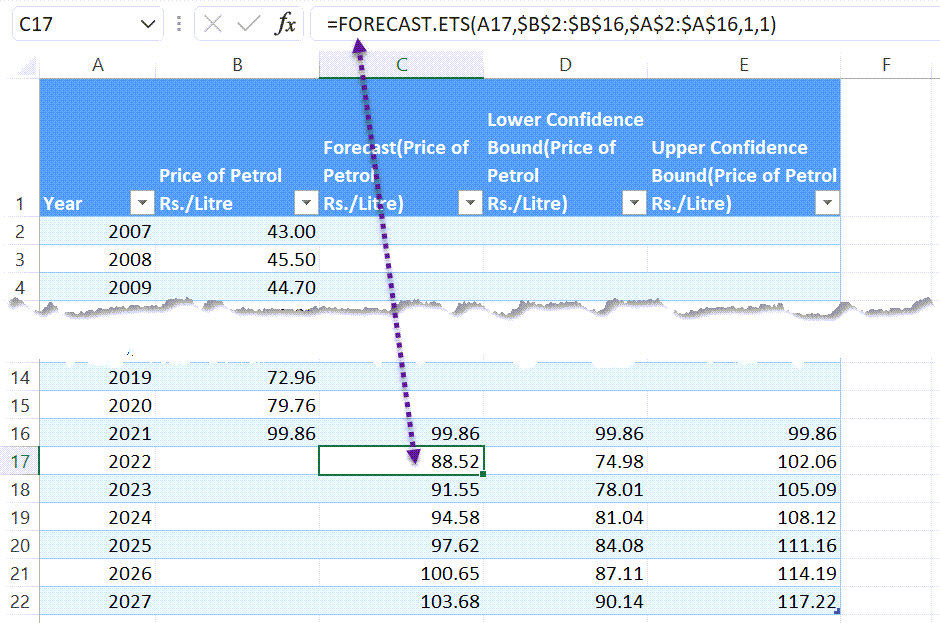
Here, Excel is predicting the future values using the existing time based data and the AAA version (Additive error, Additive trend and Additive seasonality) of the Exponential Smoothing (ETS) algorithm.
Forecasted values are generated using the FORECAST.ETS function.
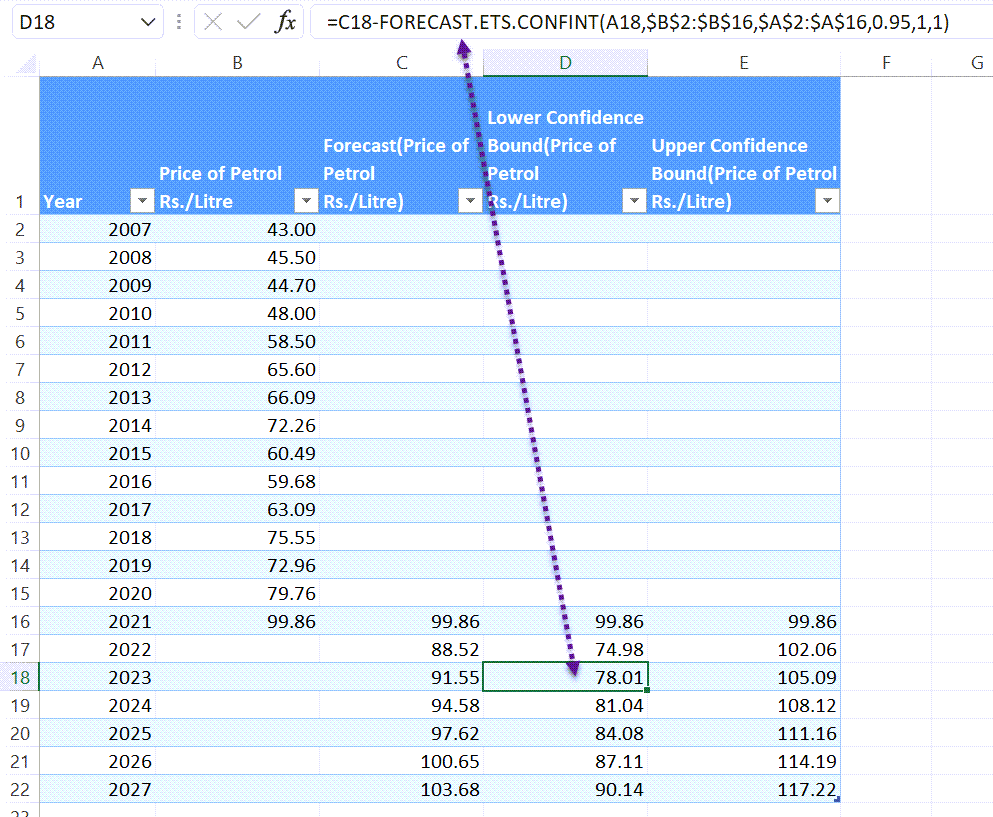
and Confidence intervals are calculated using the FORECAST.ETS.CONFINT function.
Learn how to Forecast Financial Data