Group By feature in Power Query help us to group or summarize data from different Rows on the basis of a condition or conditions.
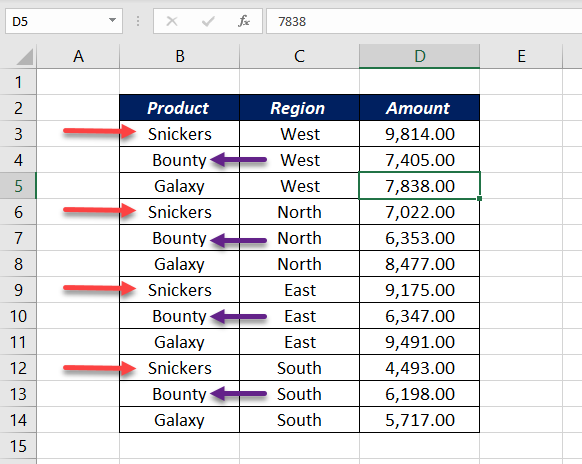
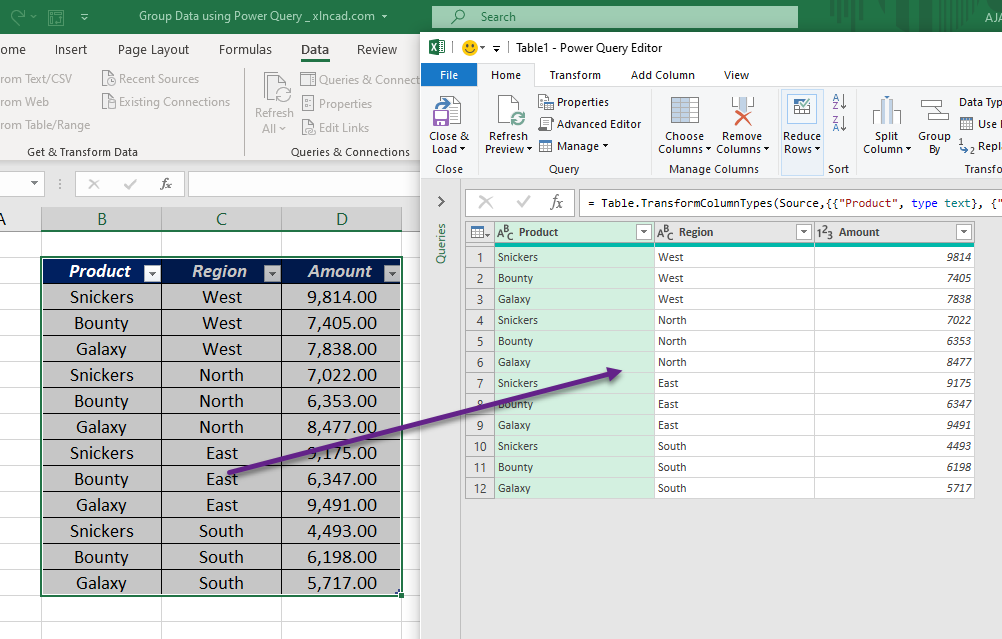
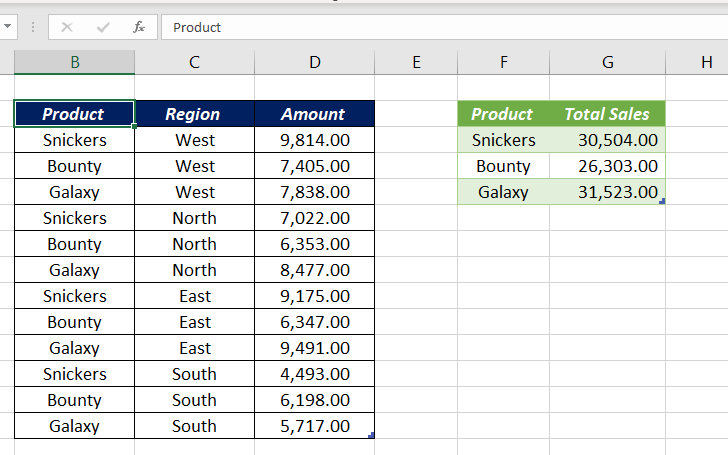
Following is a sample Sales data from which I want to create a summary report. The data contains the sales amount for 3 products Snickers, Bounty and Galaxy for 4 different regions North, South, East and West.
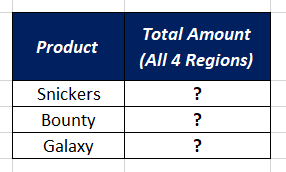
And following is the format of the Summary report which I want. i.e. the Total Sales amount for each product.
Let’s see how to create a summary from the above data using Power Query
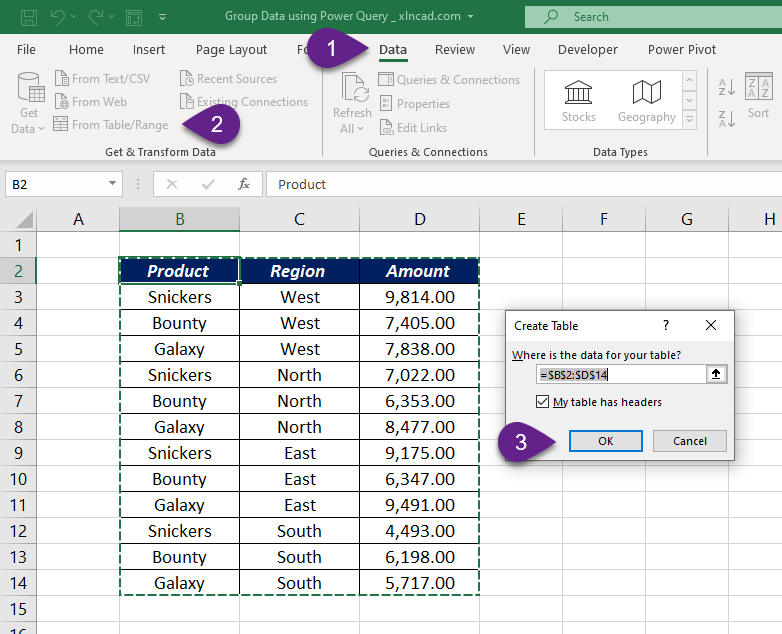
Select a cell in sales data > In the Data tab > click on From Table/Range > Click OK in the Create Table Dialog
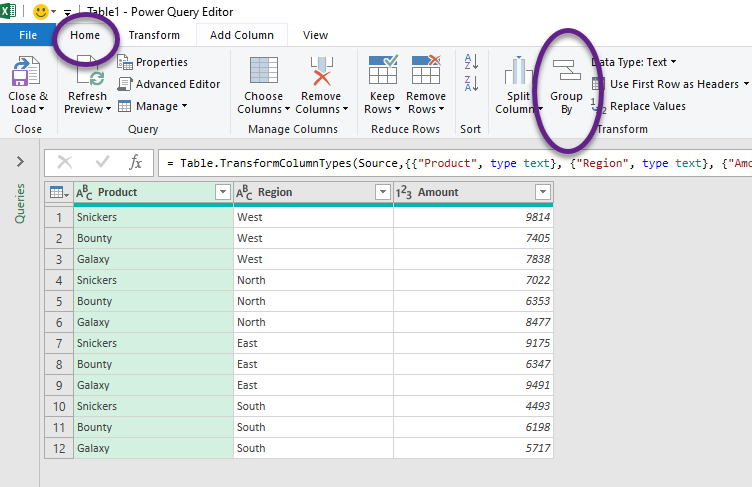
Data is loaded into the Power Query Editor.
To group data on the basis of Products, Click on Group By in the Home tab
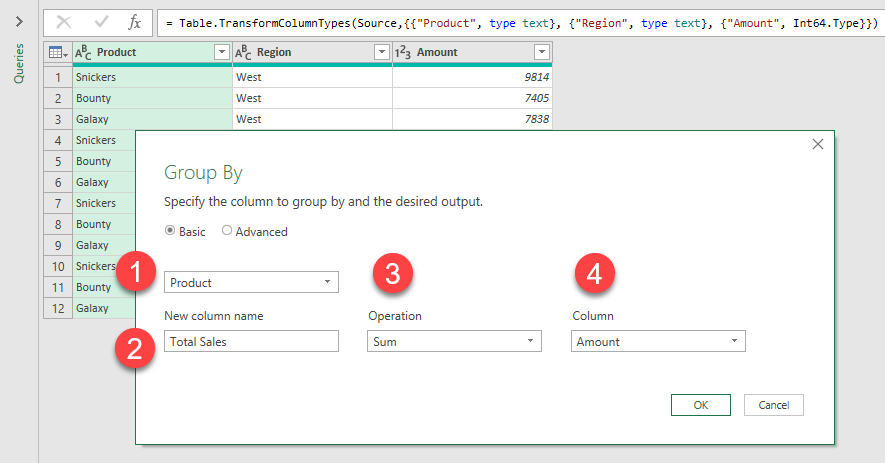
In the Group By dialog, we have to define 4 things
- Column containing items to group – Product is the column containing items to group
- New column name [optional] – Specify the name of the new column
- Operation – Here, I want the sum of amounts for each product, so I have selected Sum as operation
- Column containing values – The column called Amount contains the values to sum
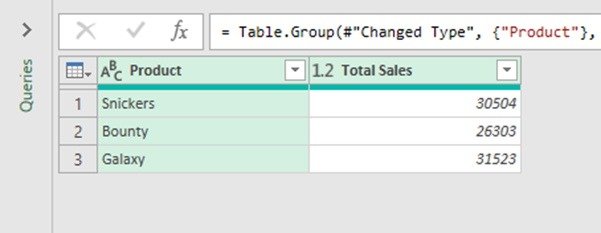
When I click OK in the Group By dialog, after defining the parameters, I will have a table like the following.
The column called Total Sales contains the total sales amount for each product.
To load this data into the worksheet, click on Close & Load in the Home tab > Close & Load to…
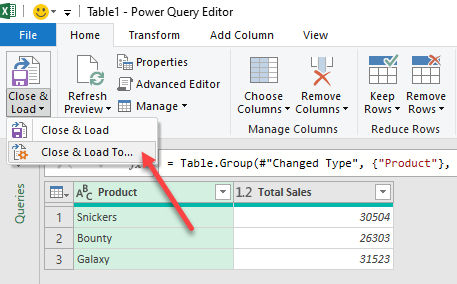
In the Import Data dialog, Select Existing worksheet > Select the cell where you want to place the data (here I have selected the cell F2) and click OK
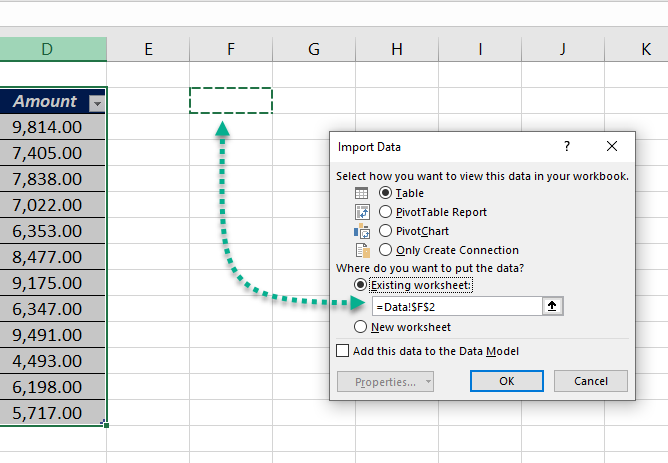
and here, we have the summary of Total sales for each Product.
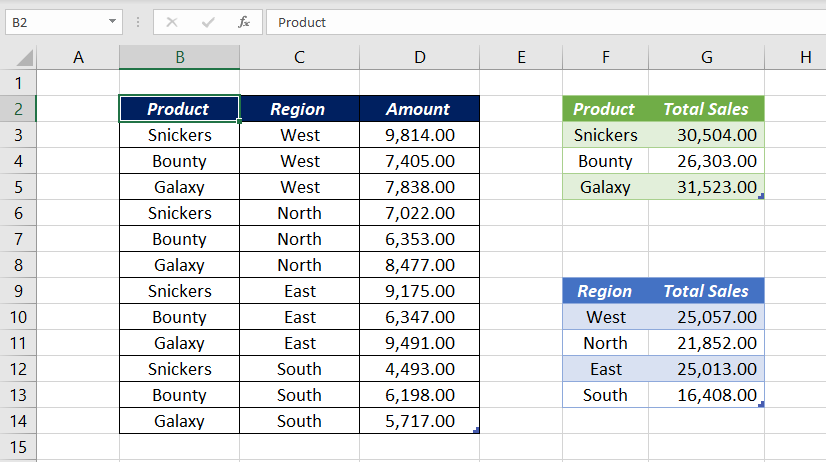
In the same manner we can group the above sales data for Region and create the summary for Region-wise sales.
Whenever you add something to the source table…
go to the Data tab in the Excel ribbon and click on the button called Refresh All to update the output tables