Interpolation estimates a value between two known points: the level at chainage 115.7 when you know the levels at 99.5 and 201.1. Excel can do it with the straight-line formula, with FORECAST.LINEAR, or straight from a whole table with a lookup.
Table of Contents
The formula
For two known points (x₁, y₁) and (x₂, y₂), the value at x is:
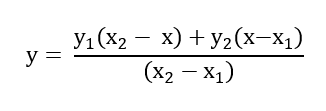
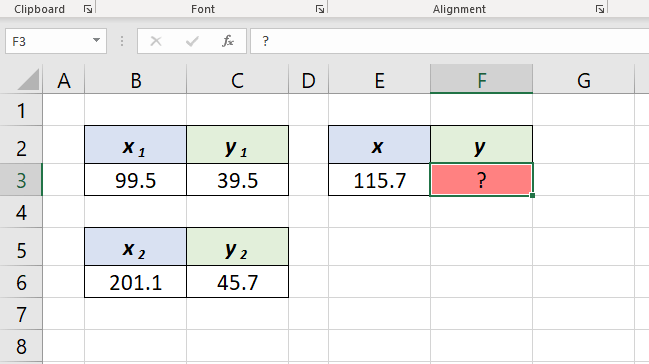
=y1+(x-x1)*(y2-y1)/(x2-x1)Example: (99.5, 39.5) and (201.1, 45.7), find y at x = 115.7.
Method 1: The formula in cells
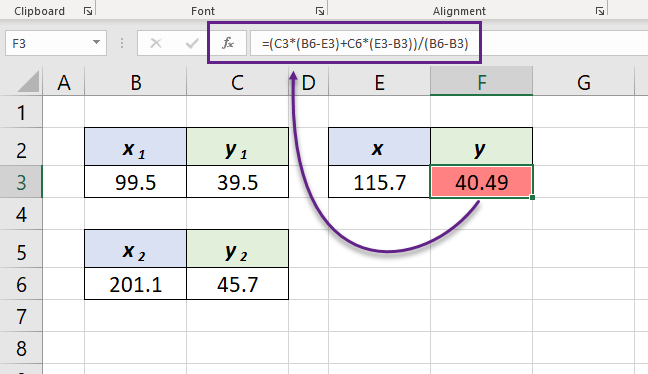
With x₁ in B3, y₁ in C3, x₂ in B6, y₂ in C6 and x in E3:
=C3+(E3-B3)*(C6-C3)/(B6-B3)The result is 40.49.
Method 2: FORECAST.LINEAR
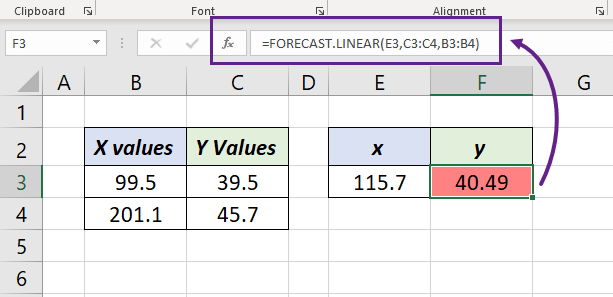
=FORECAST.LINEAR(E3,C3:C4,B3:B4)The arguments are x, the known y values, then the known x values. With exactly two points it gives the same straight-line answer. In Excel 2013 and earlier, use FORECAST with the same arguments.
A series of values at regular intervals
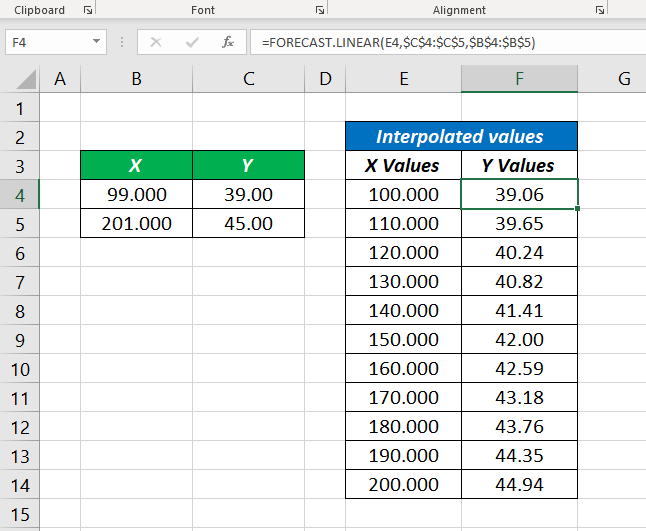
To fill levels at every 10 m between two points, lock the known points with $ and copy down:
=FORECAST.LINEAR(E4,$C$4:$C$5,$B$4:$B$5)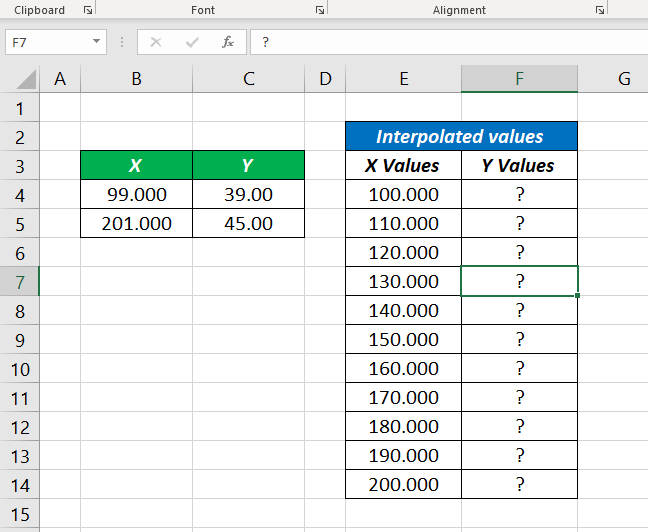
Interpolate from a whole table
Usually you have a table of many points, such as chainage and level, and need the value between whichever two points surround x. The table must be sorted by x, smallest first. With x values in B3:B20, y values in C3:C20 and x in E2:
=FORECAST(E2,OFFSET(C3,MATCH(E2,B3:B20,1)-1,0,2),OFFSET(B3,MATCH(E2,B3:B20,1)-1,0,2))MATCH finds the last x that is less than or equal to E2, and OFFSET picks that row and the next, so FORECAST works on just those two points. Example: between (100, 25) and (150, 40), x = 120 gives 31.
Excel 365 version with LET
=LET(x,E2,i,MATCH(x,B3:B20,1),x1,INDEX(B3:B20,i),x2,INDEX(B3:B20,i+1),y1,INDEX(C3:C20,i),y2,INDEX(C3:C20,i+1),y1+(x-x1)*(y2-y1)/(x2-x1))Longer, but each part is named, so it's easy to check. Both formulas return #N/A or #REF! if x is outside the table, or exactly equal to the last x value.
Things to know
- Linear interpolation assumes a straight line between the two points. For curves, use more points closer together.
- Estimating outside the known range is extrapolation, and much less reliable.
- FORECAST.LINEAR with more than two points fits one best-fit line through all of them, which is not interpolation. Use the table method instead.