To illustrate the reporting relationships in your organization or company, you can use SmartArt graphics in Excel.
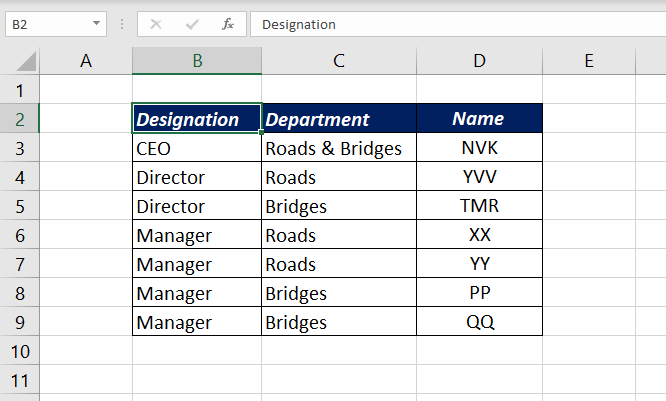
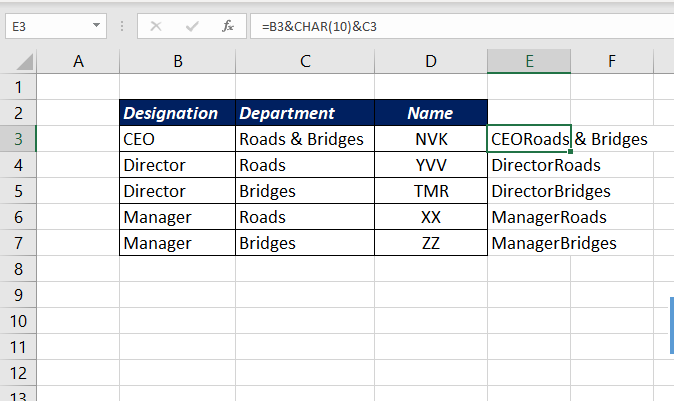
Suppose we have a hierarchy list like the following, where there is CEO, two Directors and a Manager under each director.
To create an Organizational chart using this data,
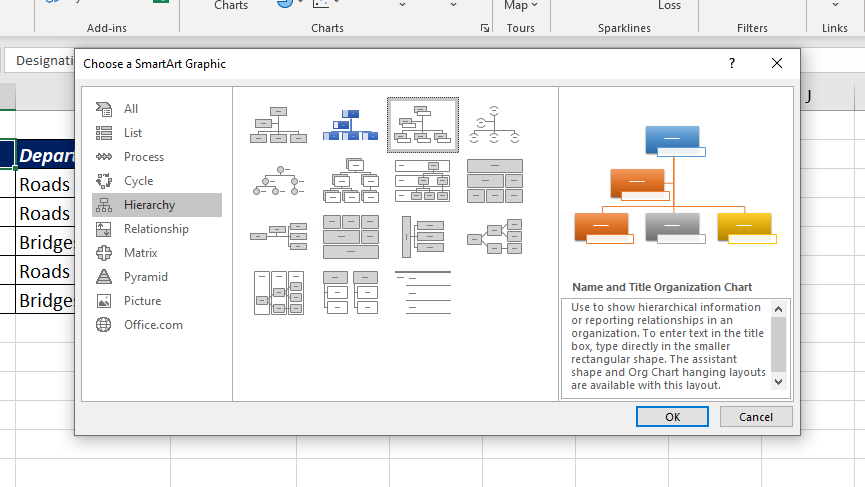
Go to Insert tab of the Excel ribbon > Illustrations > SmartArt
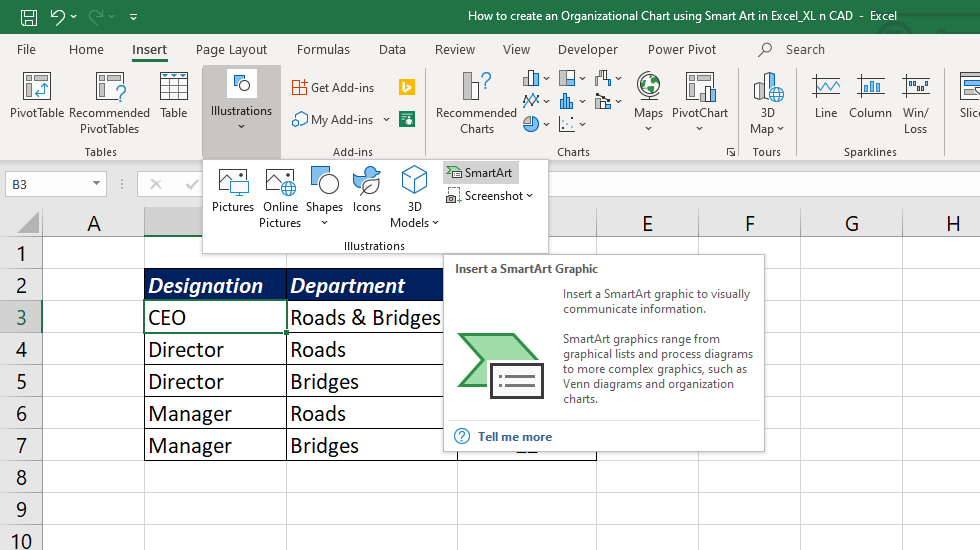
Select Hierarchy in the left sidebar of Choose a SmartArt Graphic dialog > Select Name and Title Organization Chart > Click OK
A diagram like the following will be inserted into the Excel sheet

Use the Text Pane option in the Design tab to add and delete boxes

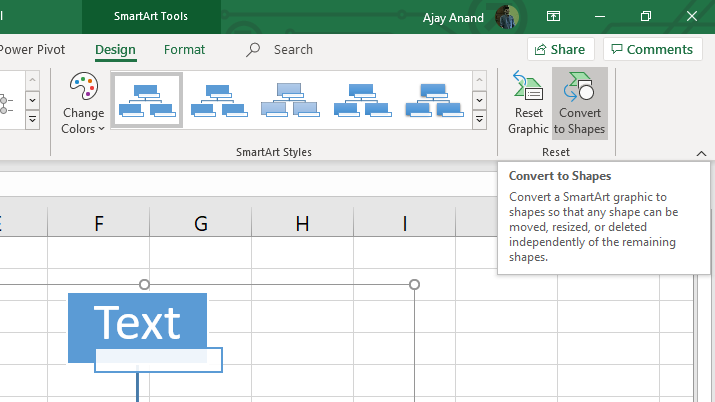
If you want to type in the Designation and Names, Text Pane can be used for that. But if you want to link the cells containing data to these boxes, you need to convert this diagram into Shapes, first.
Click on Convert to Shapes in the Design tab
Now that the SmartGraphic is converted into Text boxes these can be linked to cells in the worksheet.
To display the Designation and the Department in a single Textbox with a linebreak in between, I will concatenate these two text items into a cell using the following formula
=B3&CHAR(10)&C3
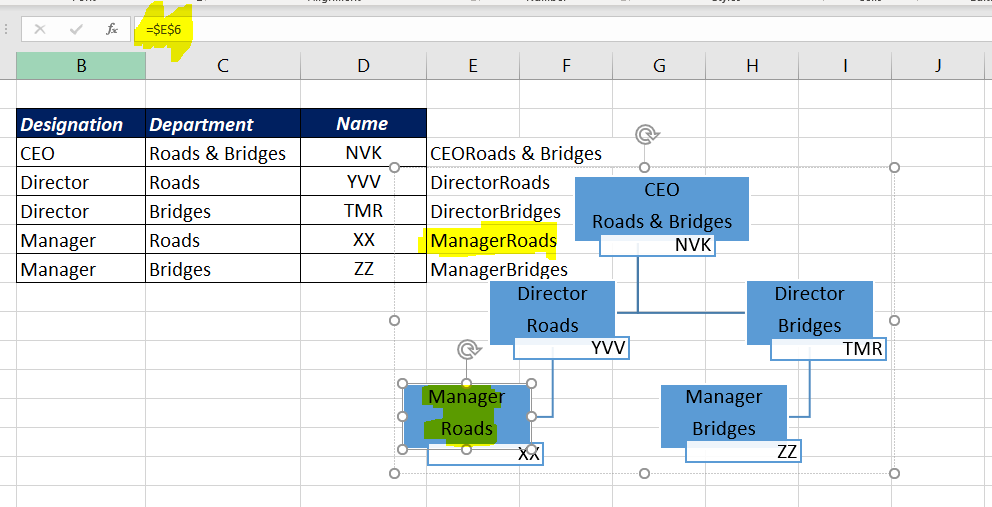
To link a Text box to a particular cell,
Select the Text box > Click on Formula bar > Type in = (Equal sign) in the formula bar > Select the cell to be linked.

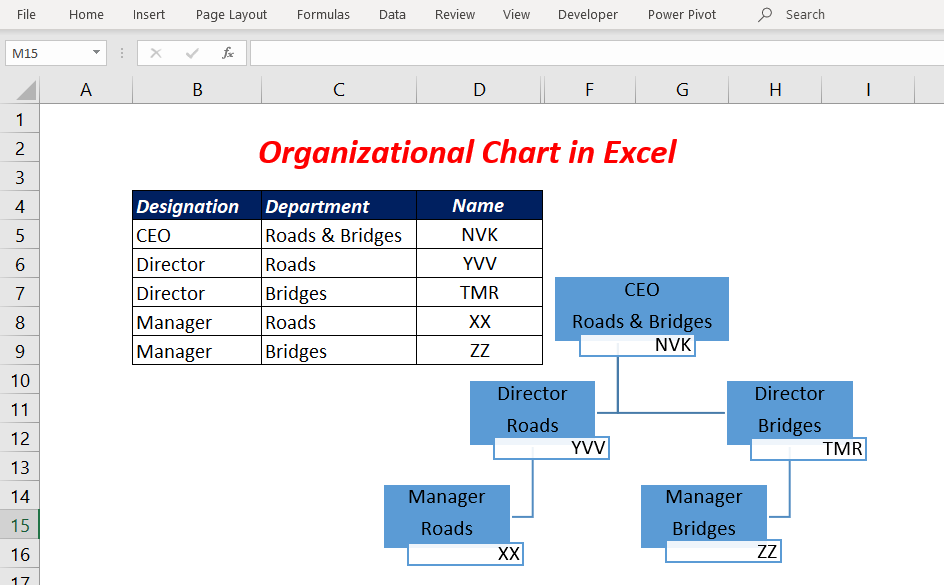
Following is the Organizational Chart with all text boxes linked to the source data in the range B3:D7